One-shot Parametirc Audio Production Style Transfer with Application to Frequency Equalization
Supplementary material for our ICASSP2020 paper.
The presentation of our work:

Authors
Stylianos I. Mimilakis, Nicholas J. Bryan, Paris Smaragdis
Introduction
Audio production is a difficult process for most people, and properly manipulating sound to achieve a certain effect is non-trivial. We present a method that facilitates this process by inferring appropriate audio effect parameters. This page provides supplementary material to our work that gives an emphasis to frequency equalization (EQ). The supplementary material focuses on three “qualitative” aspects:
- Frequency responses
- Audio examples
- Latent feature visualization
- Application Scenarios
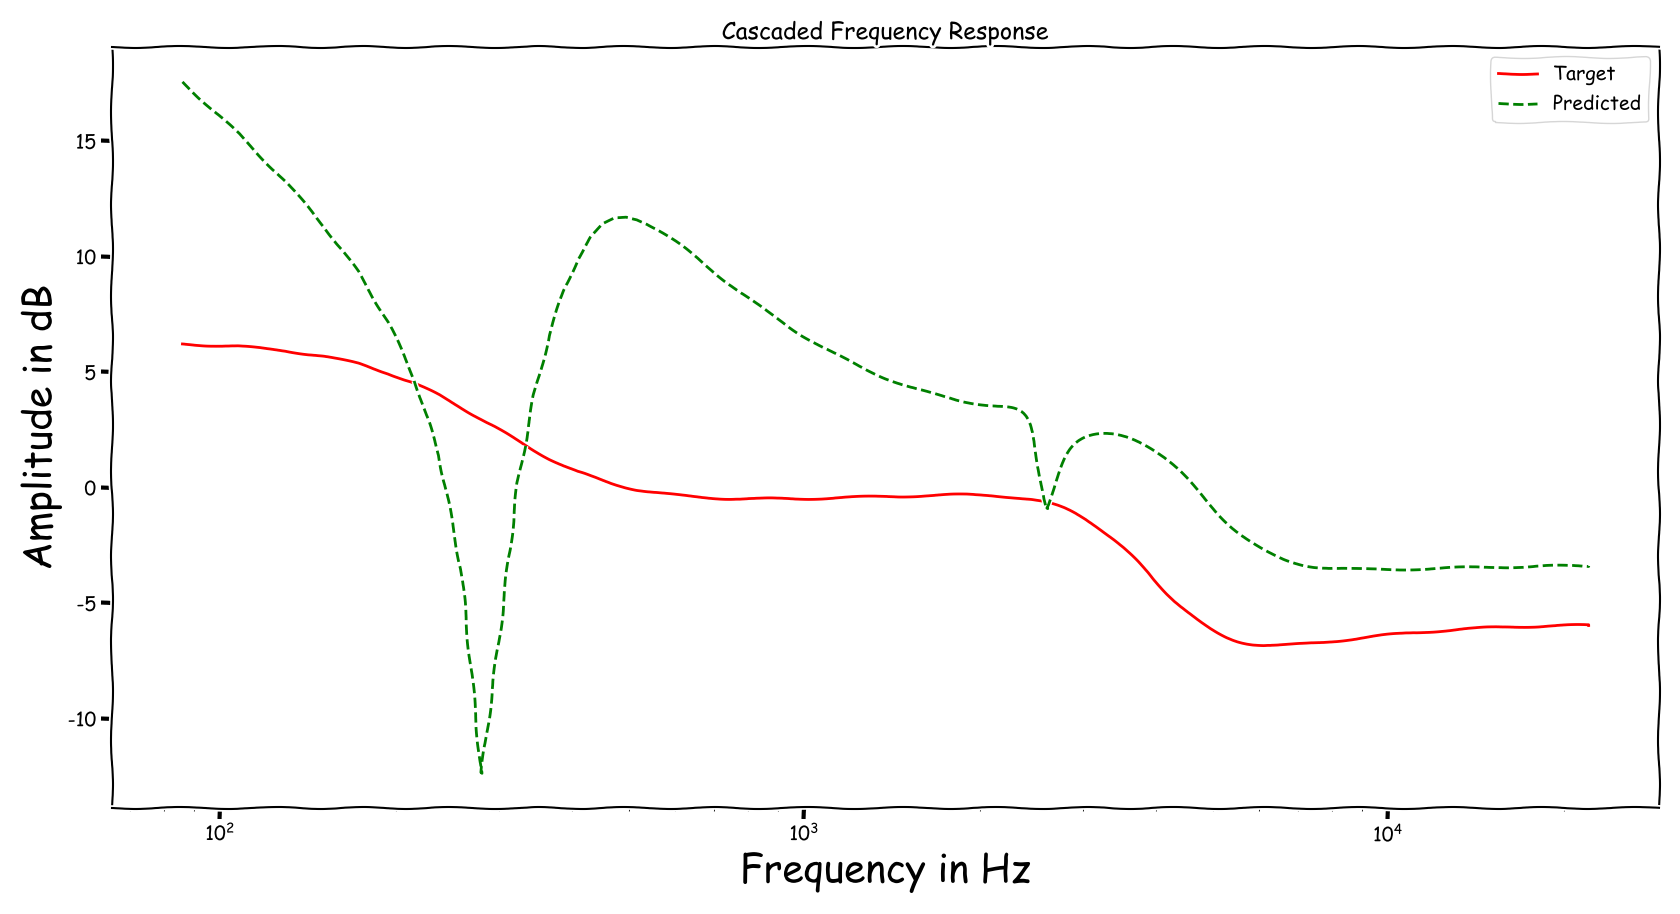
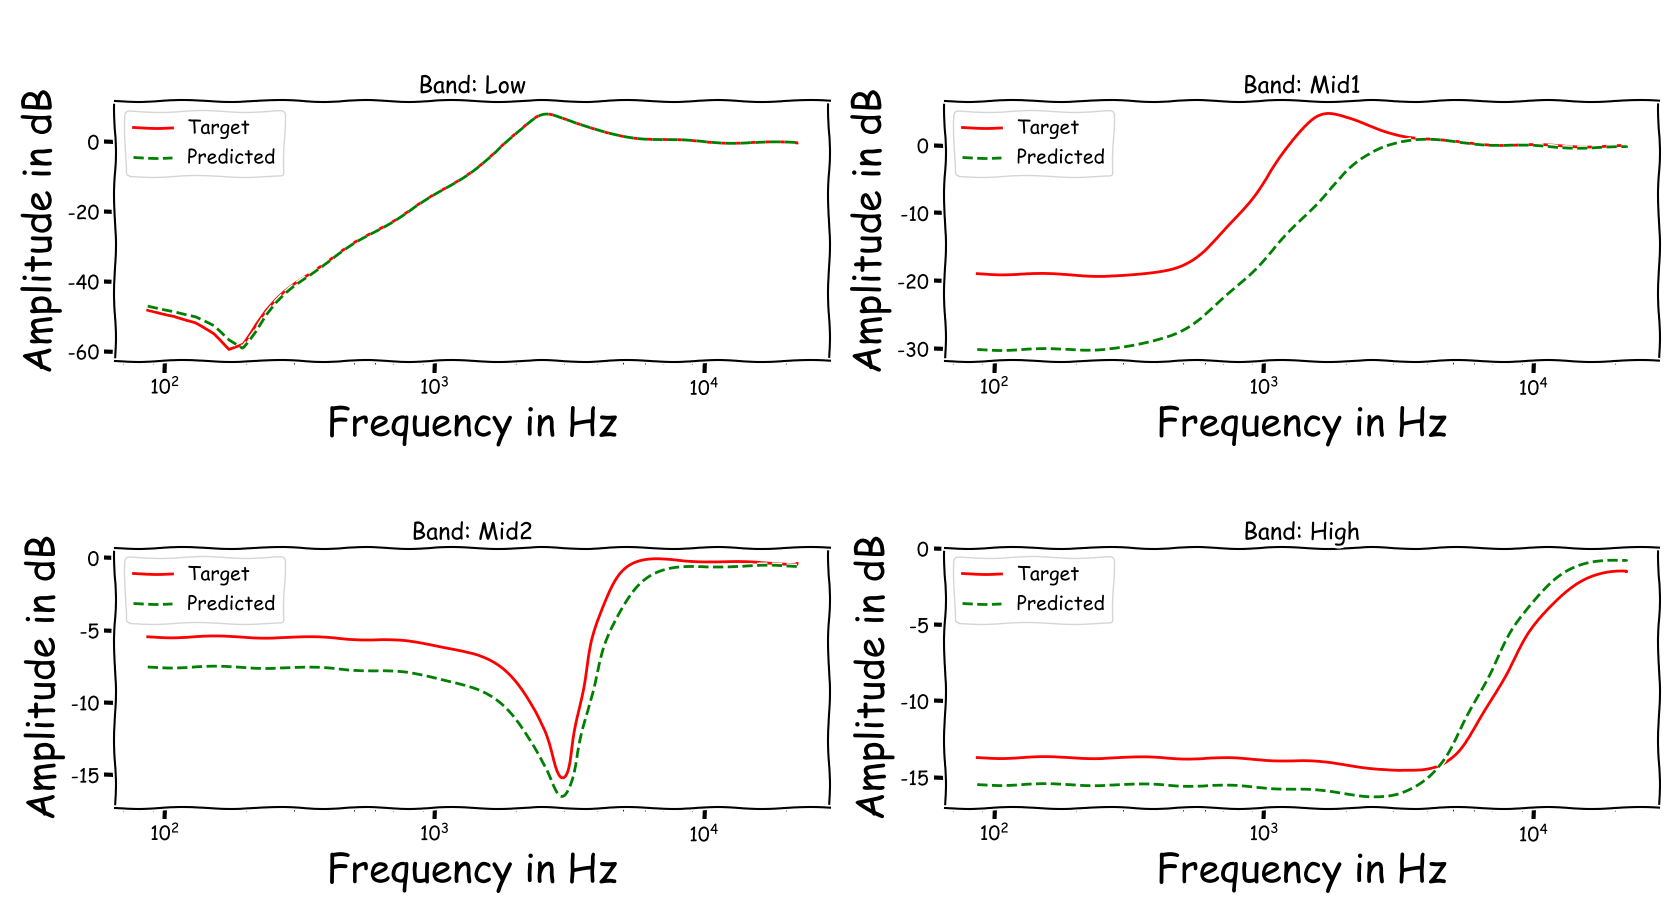
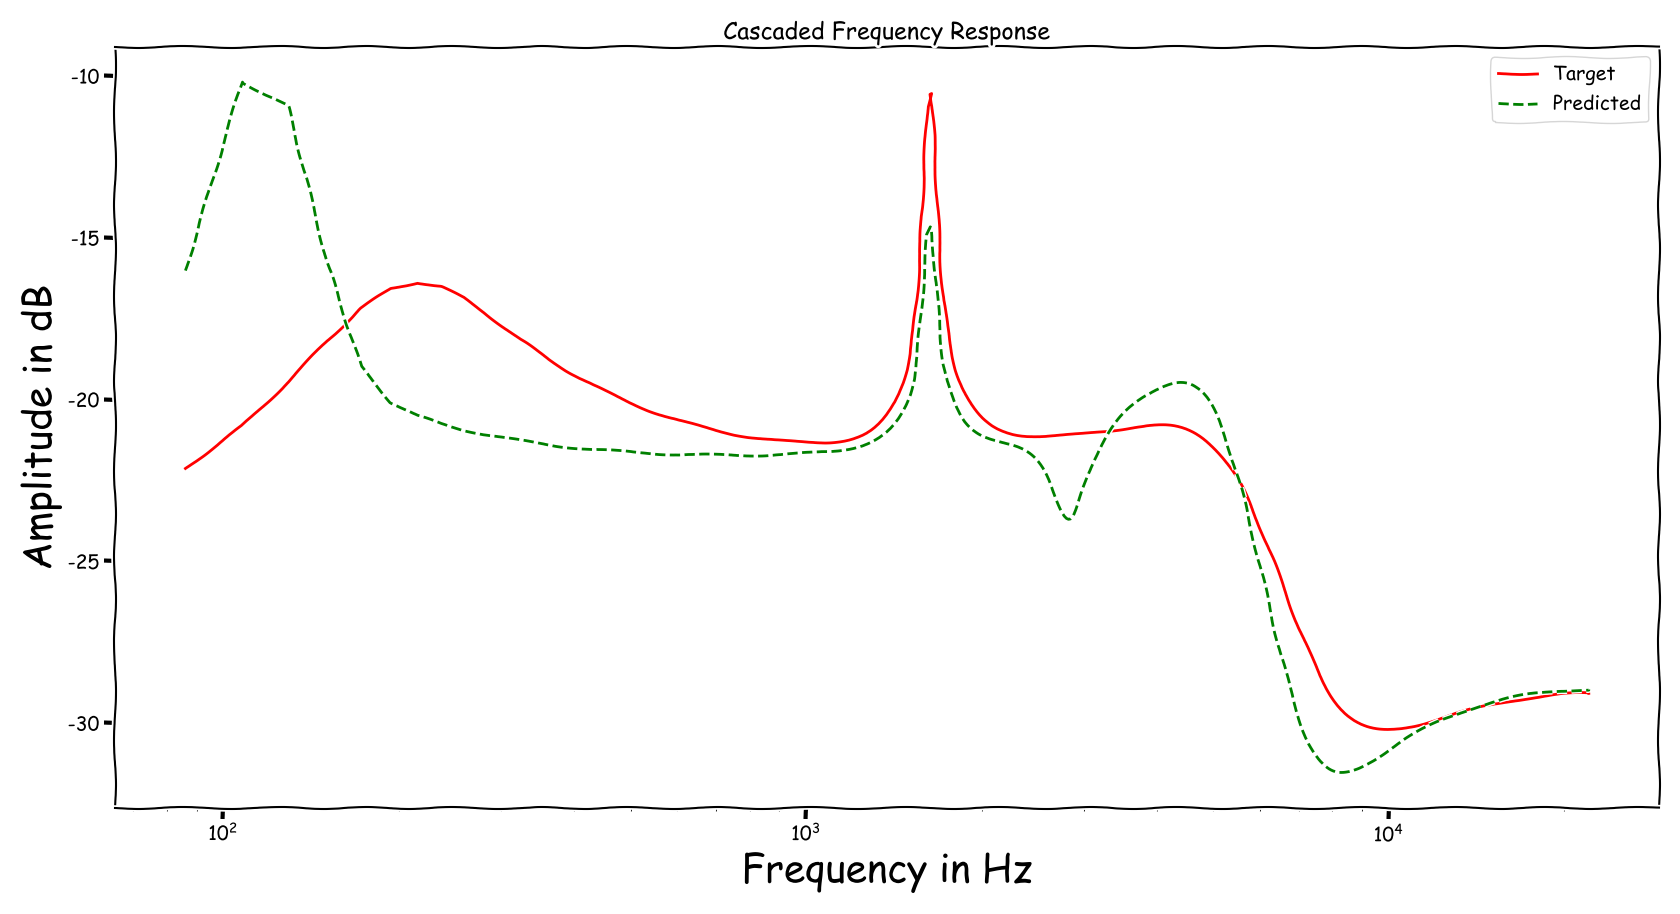
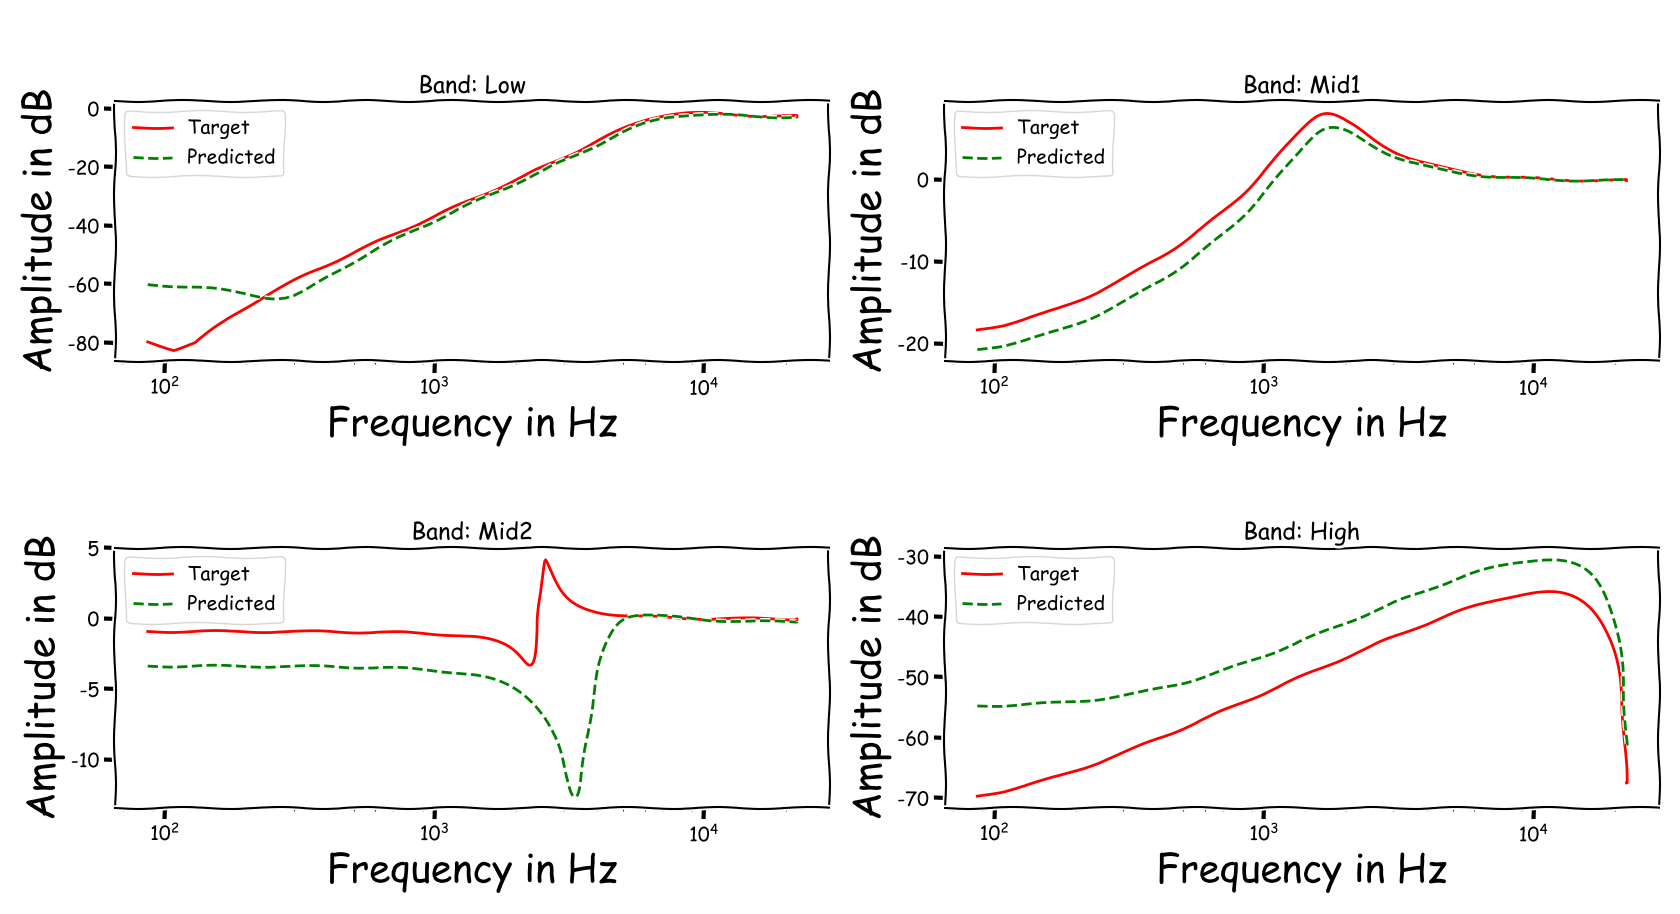
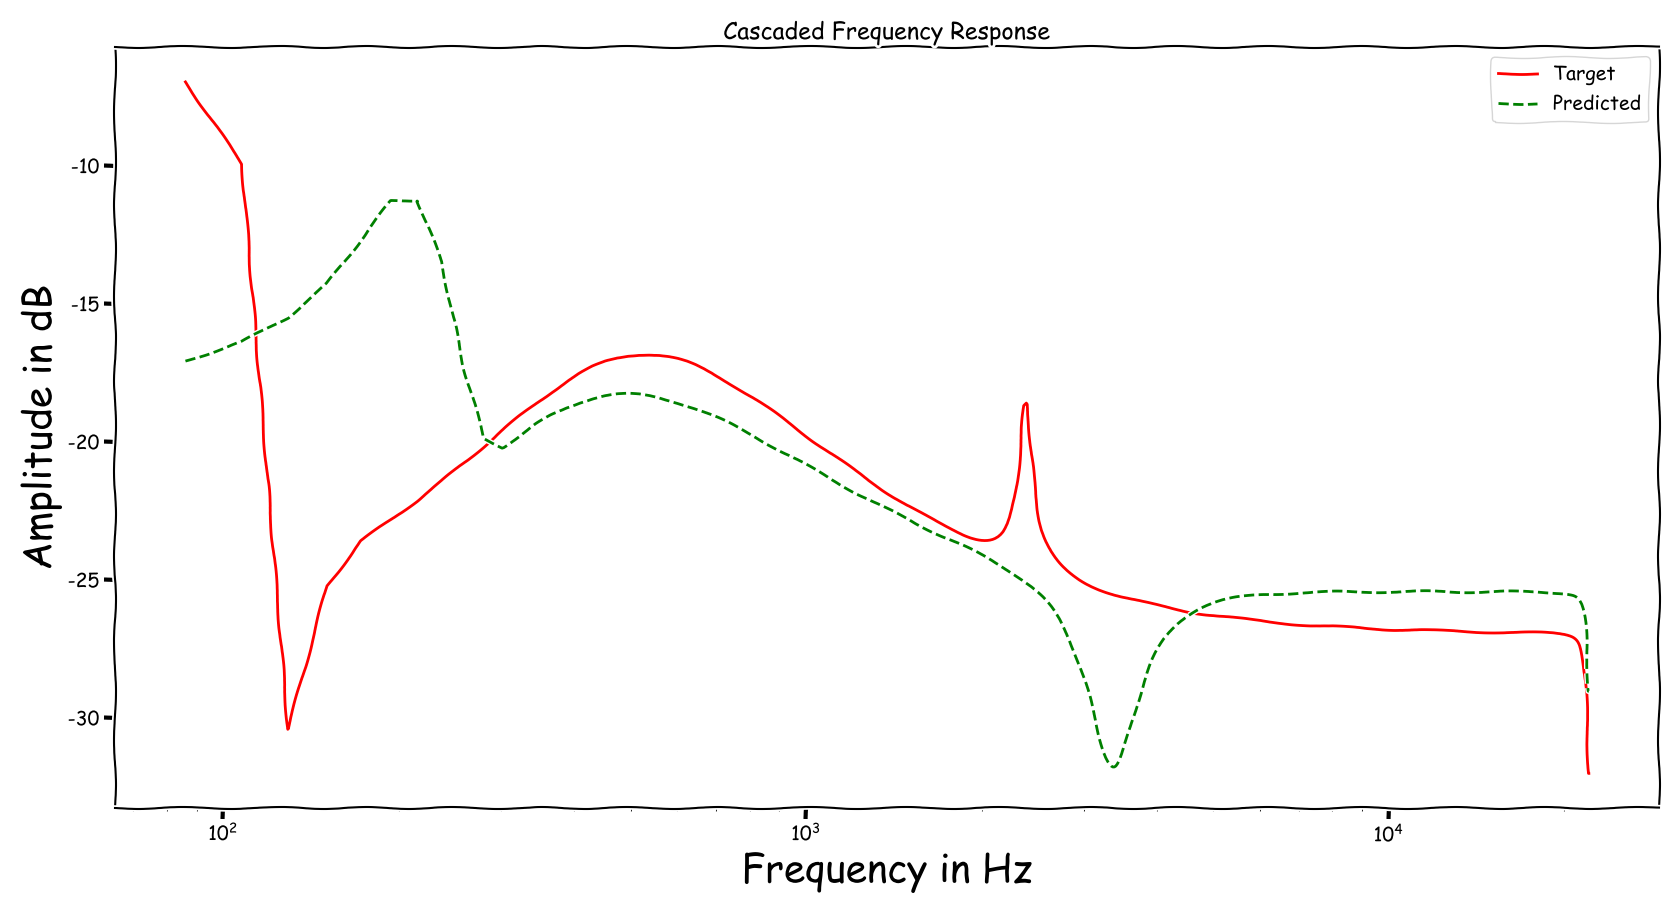
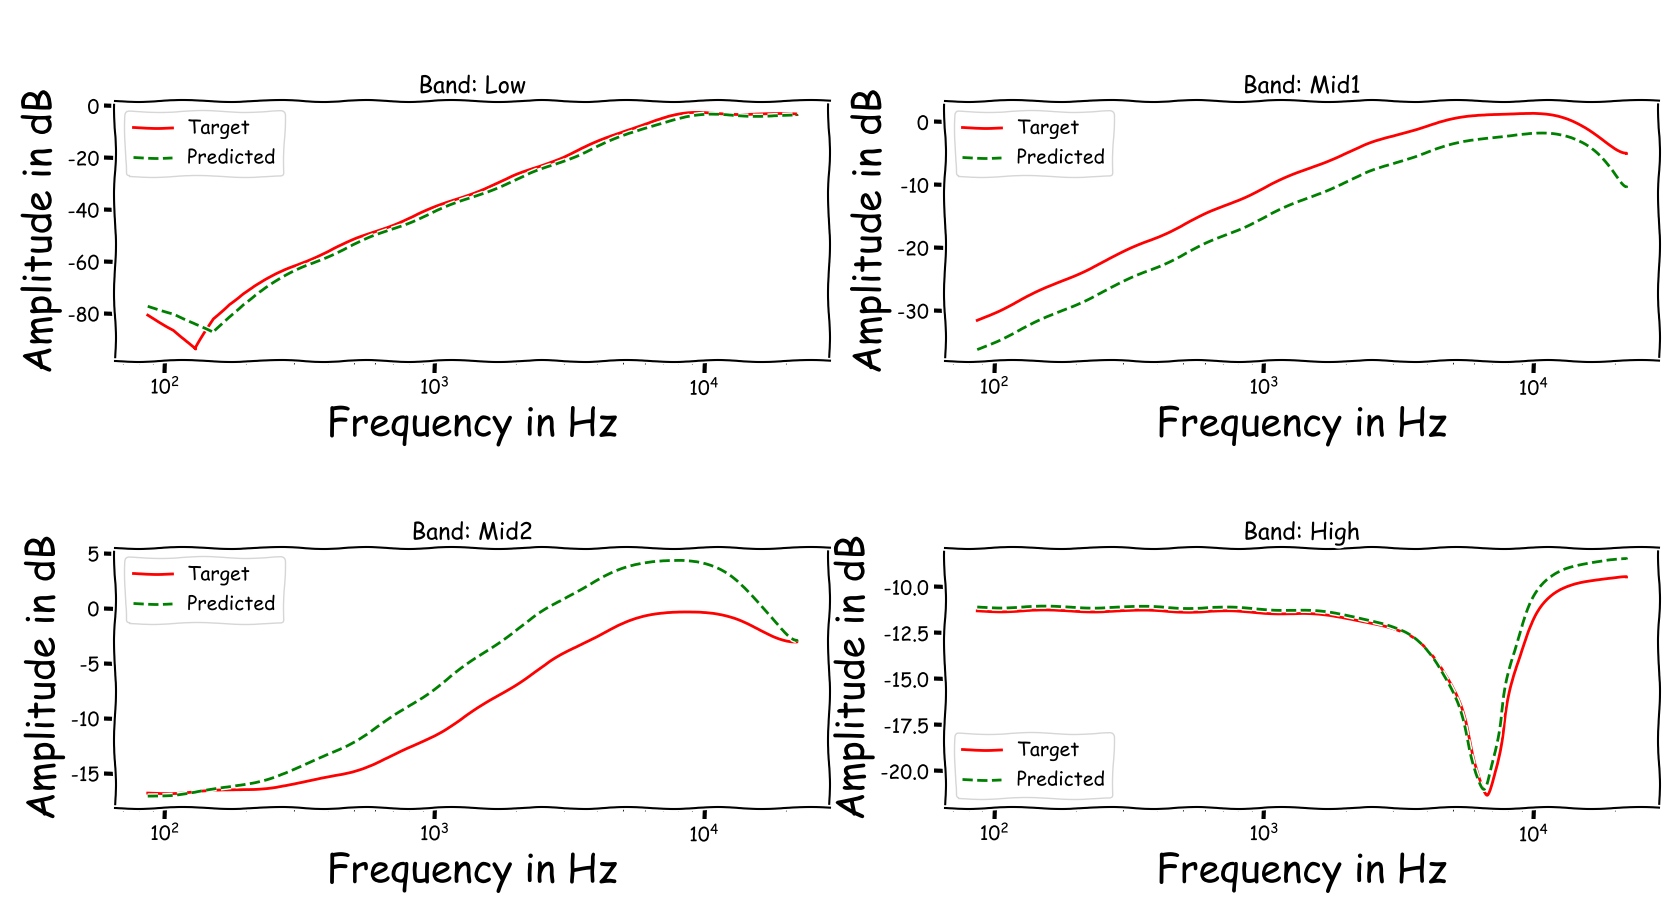
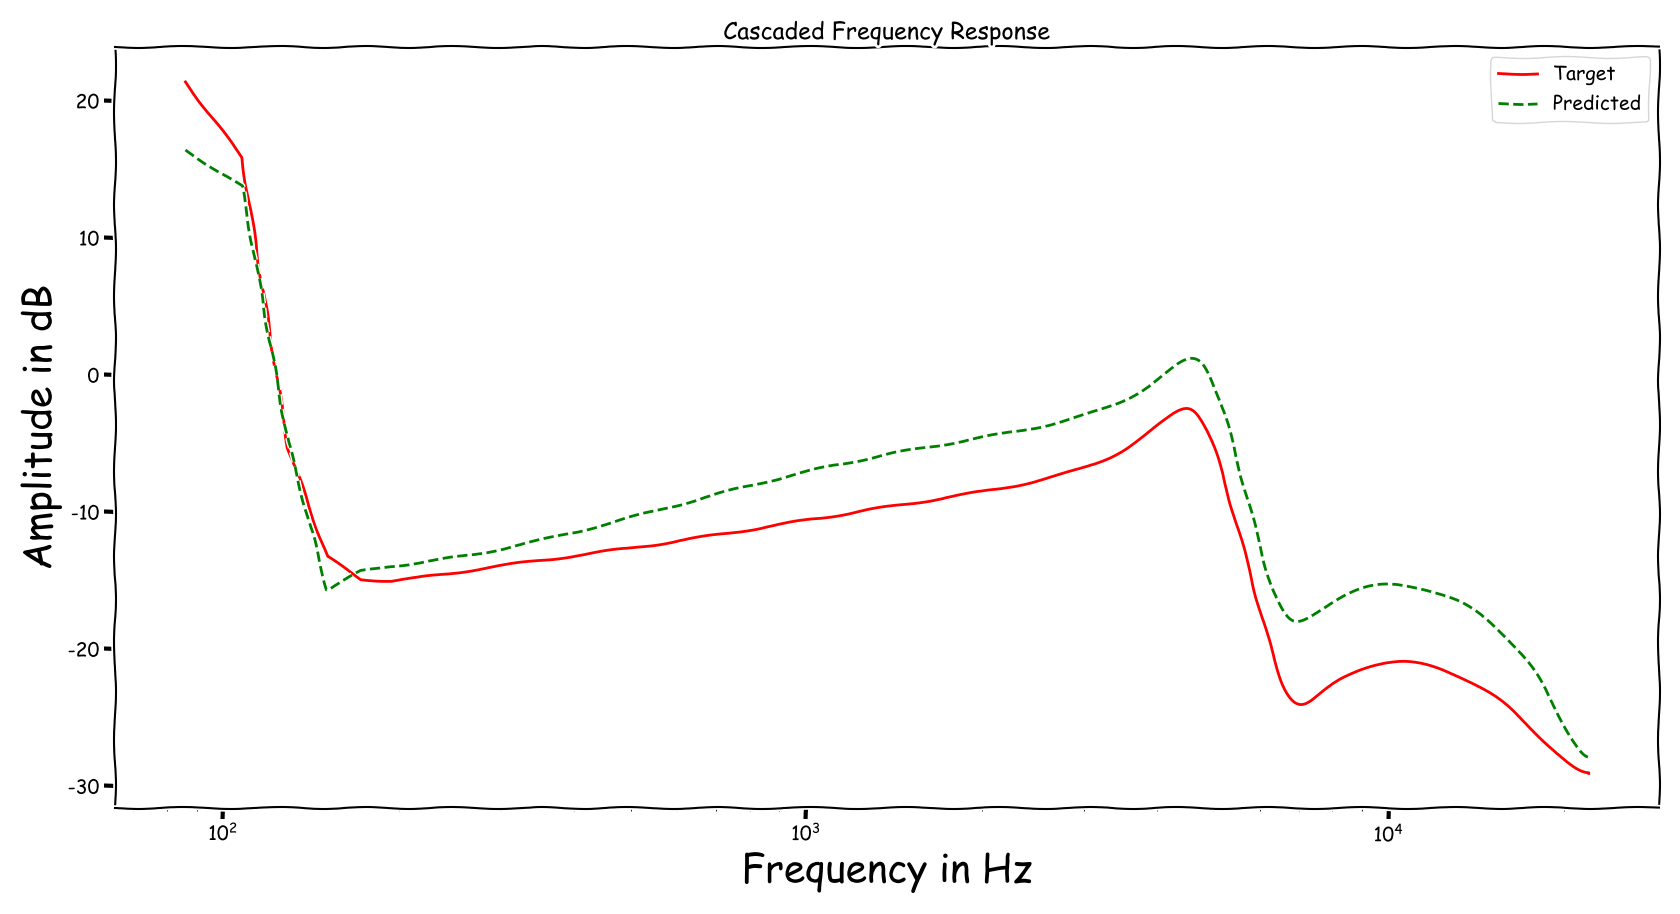
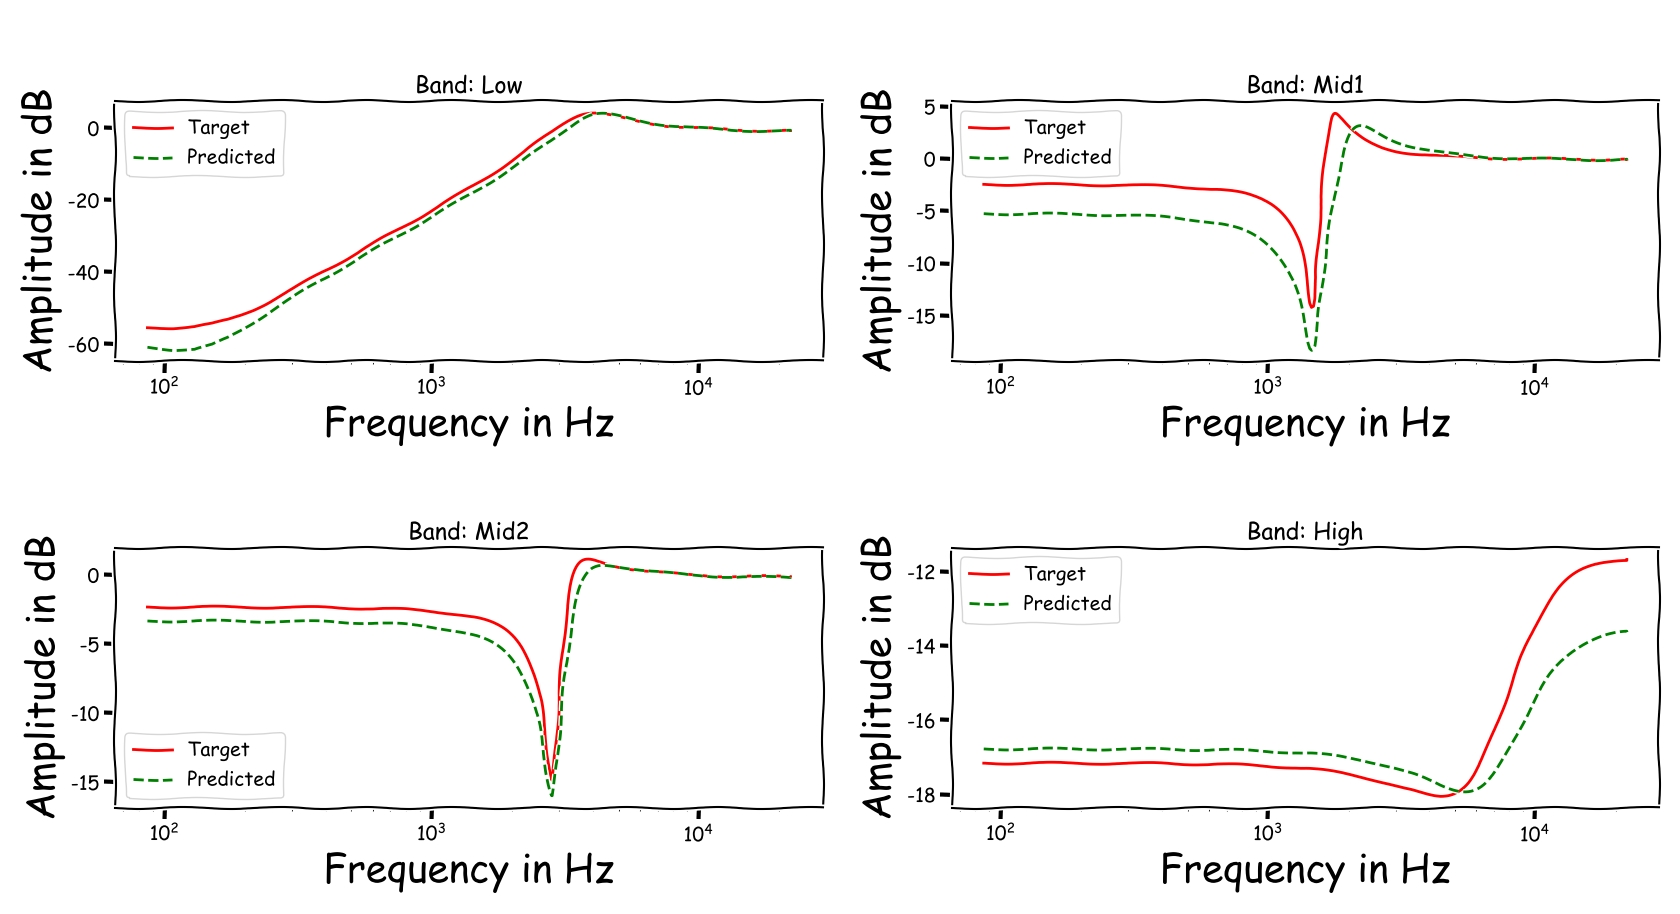
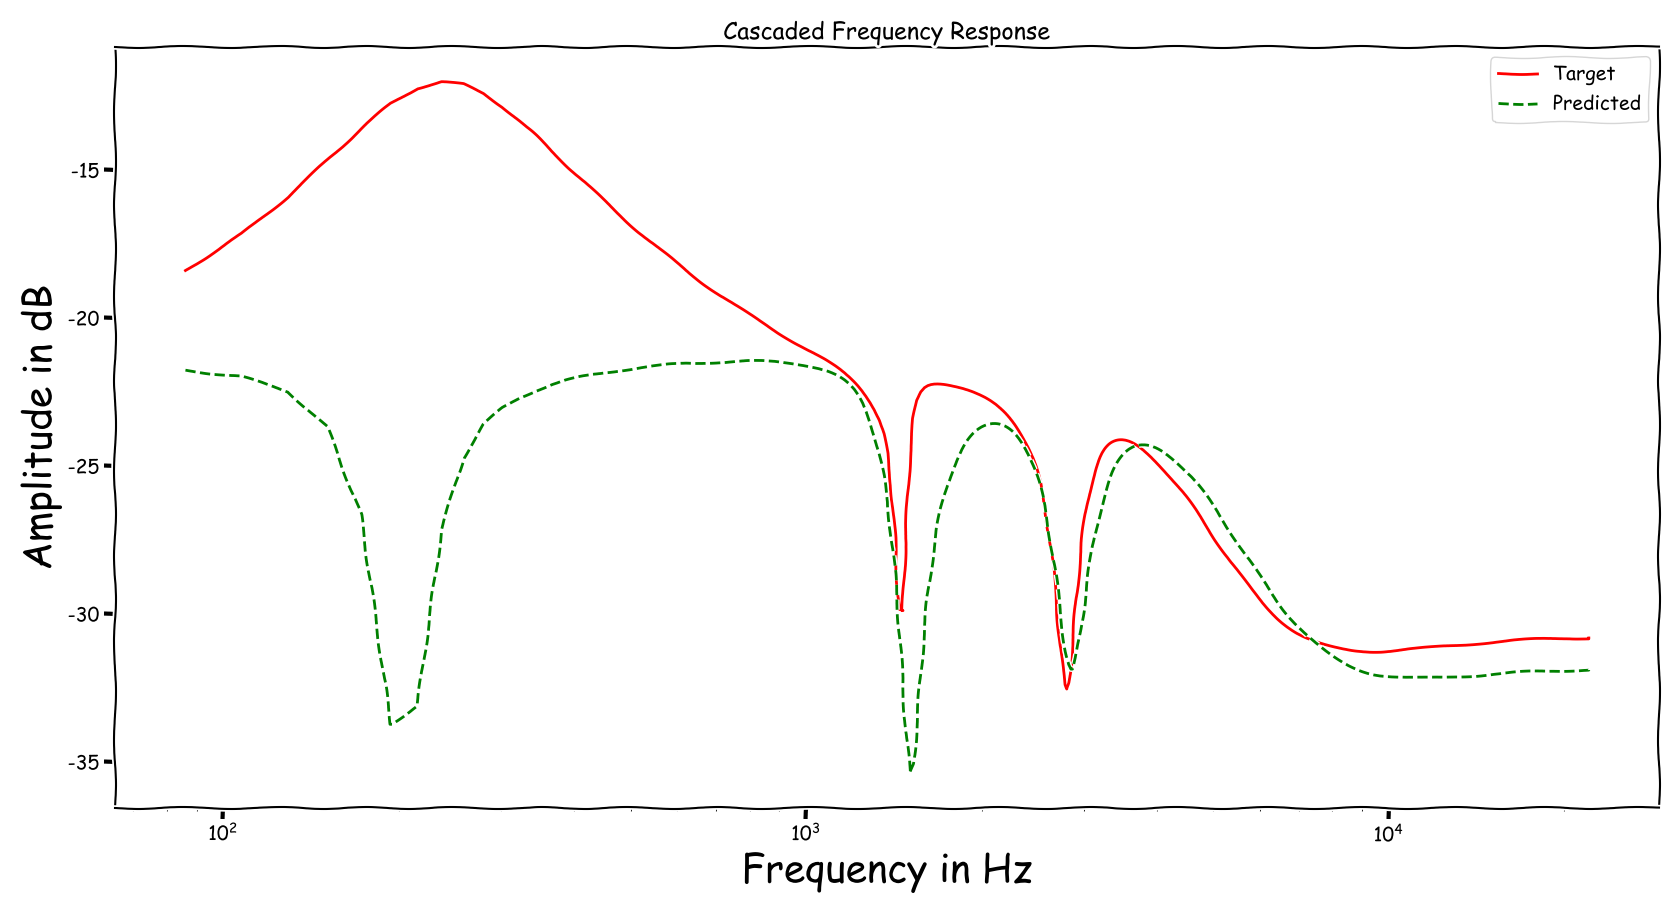
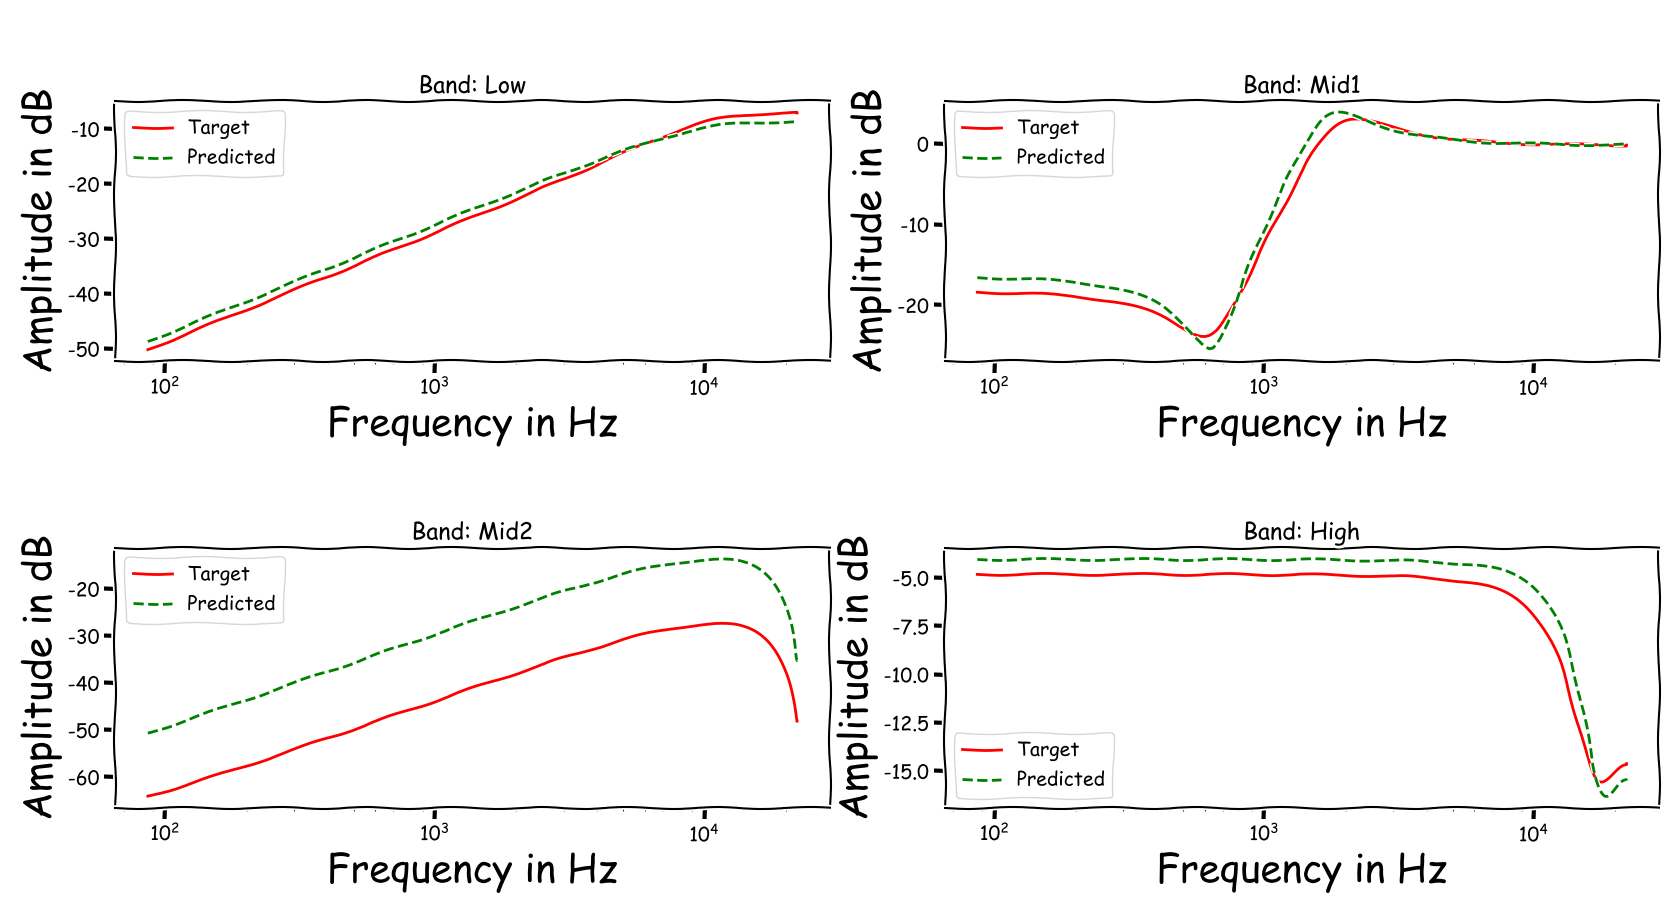
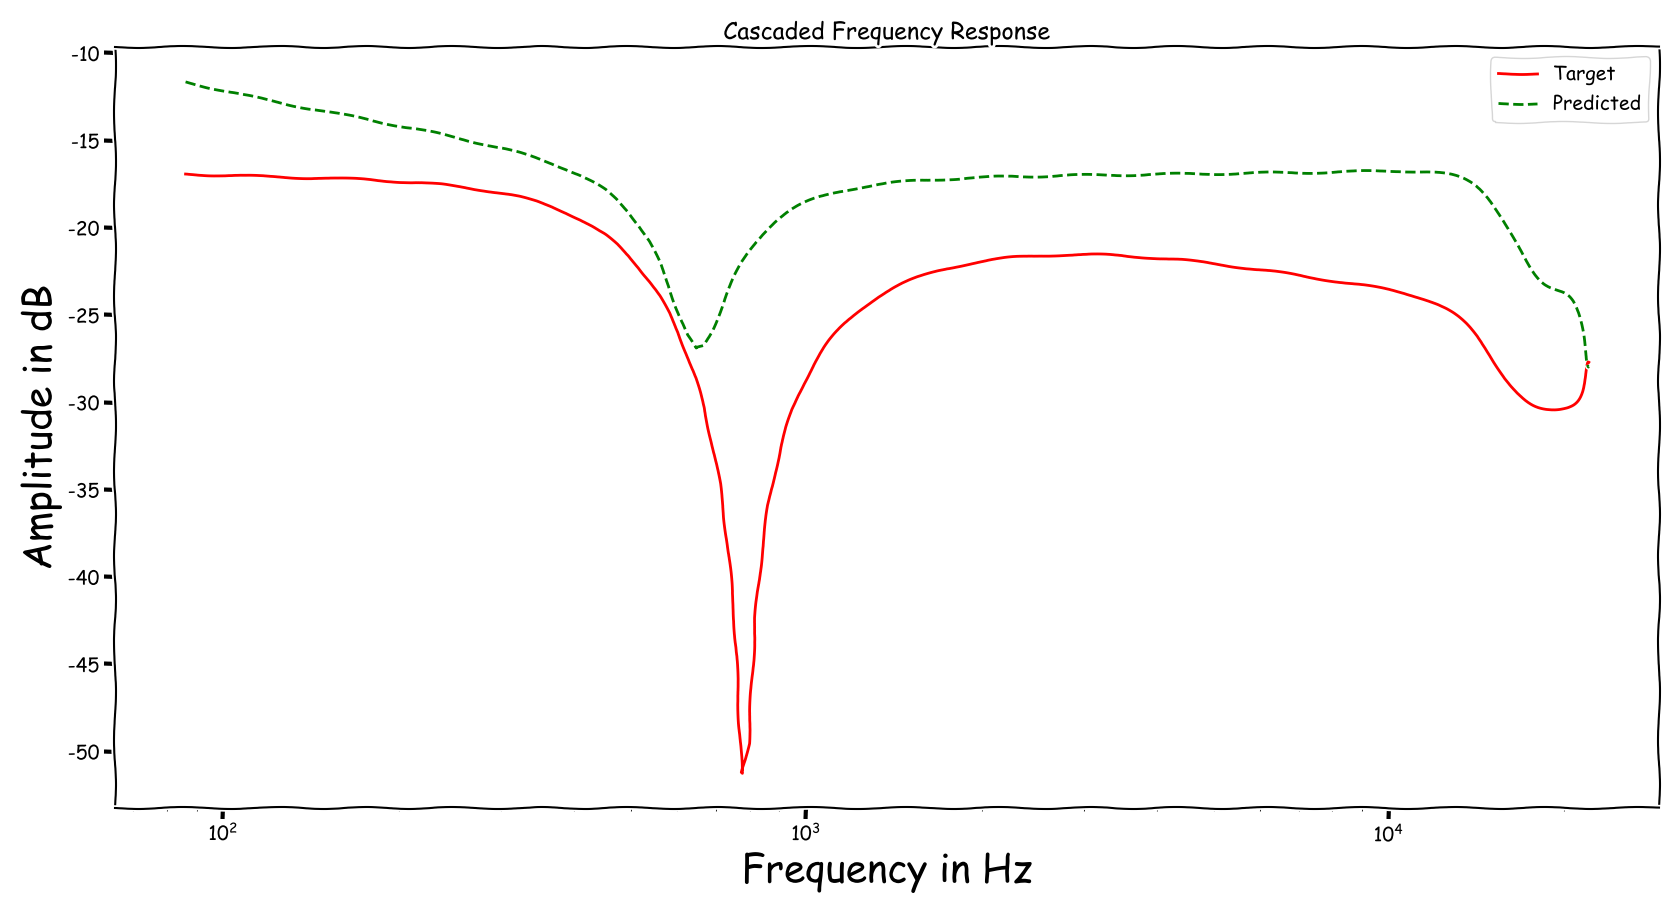
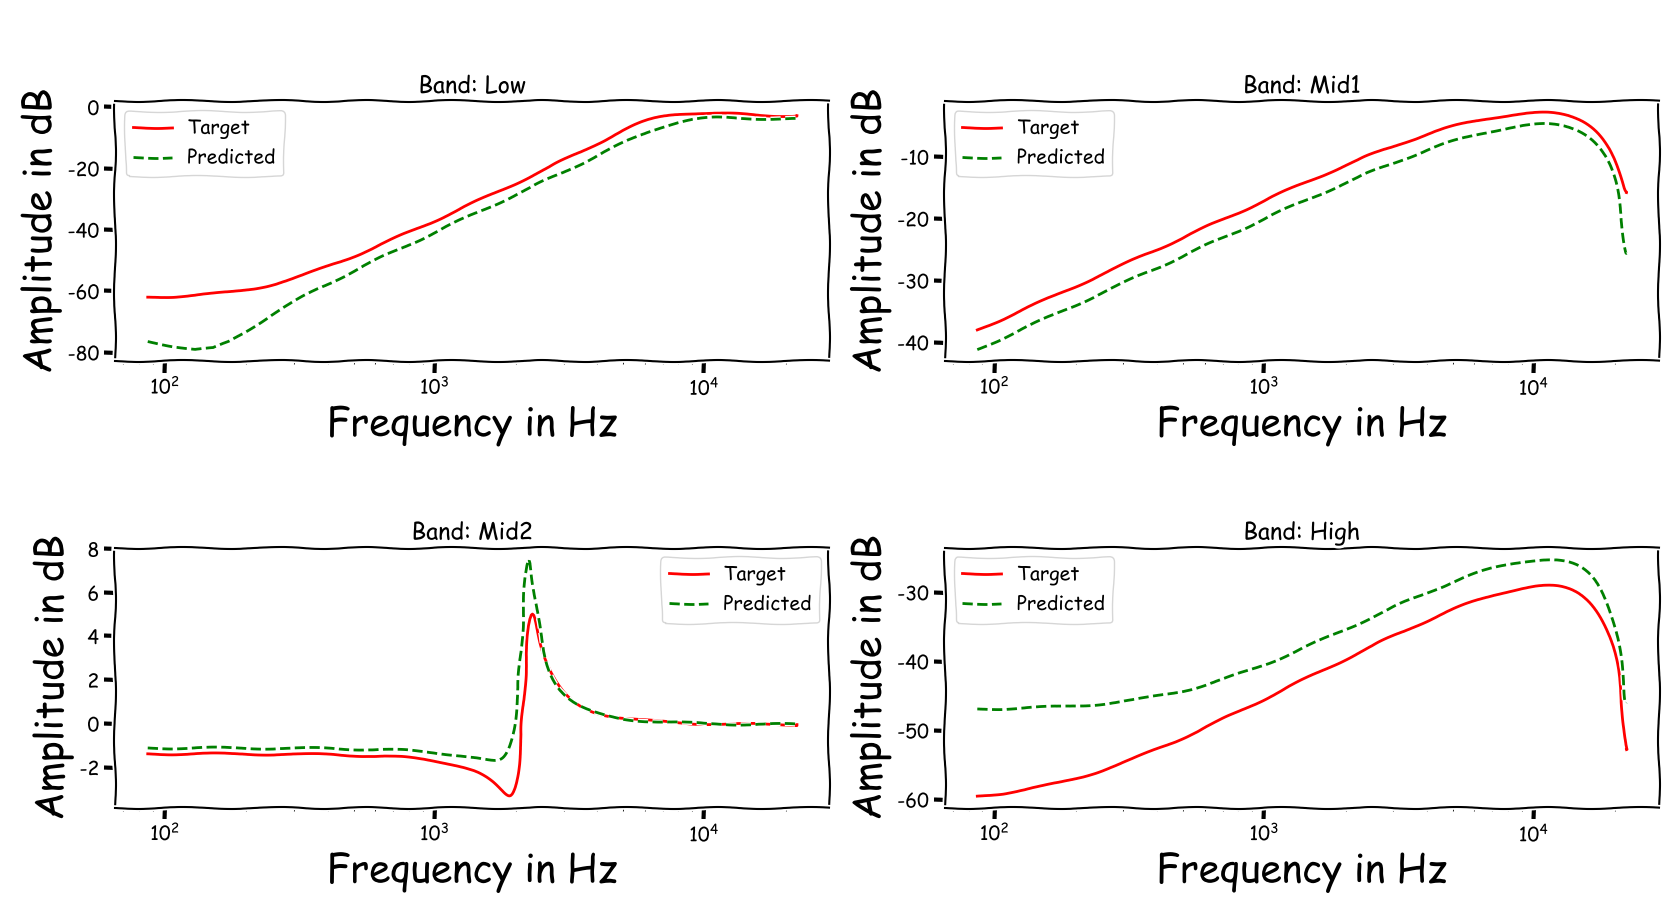
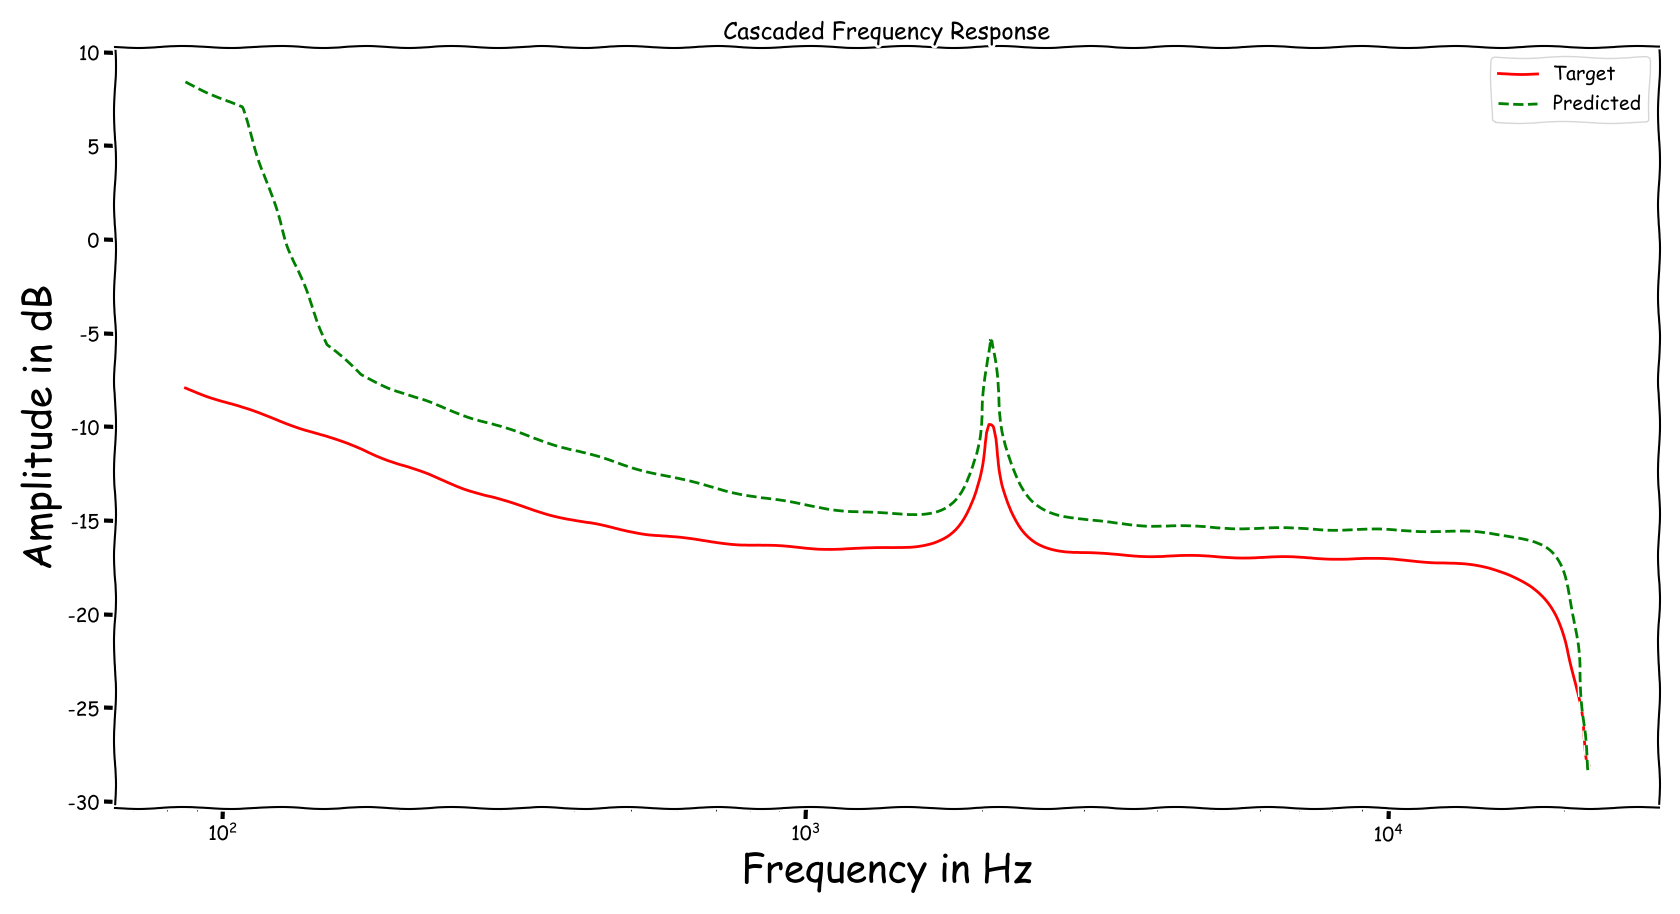
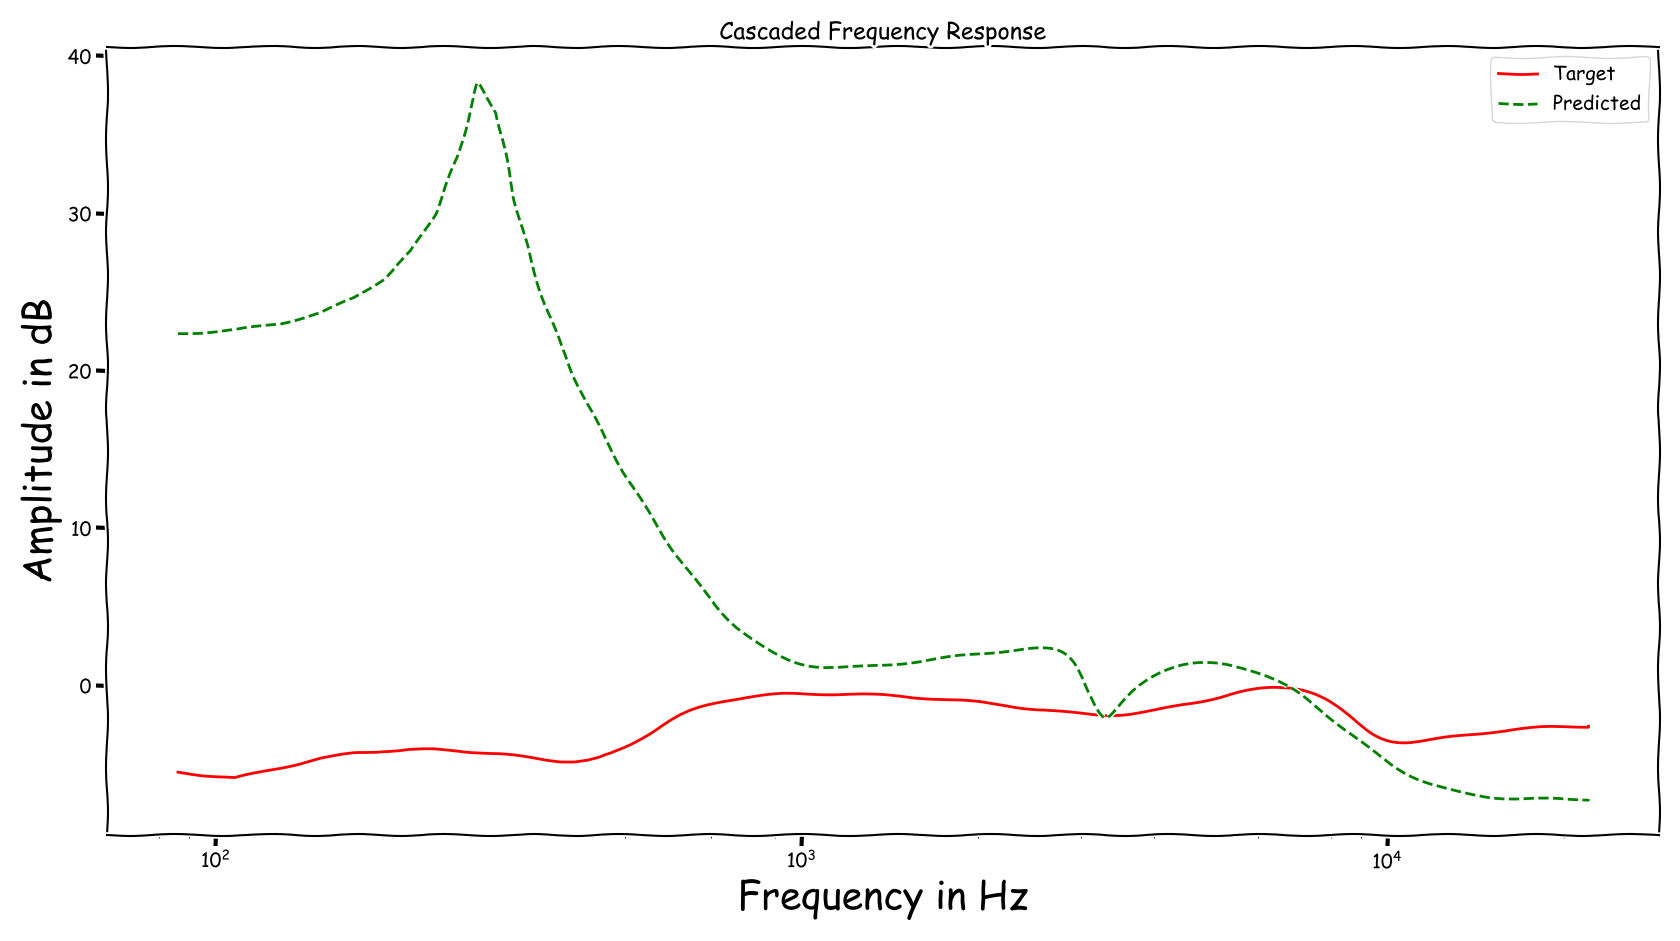
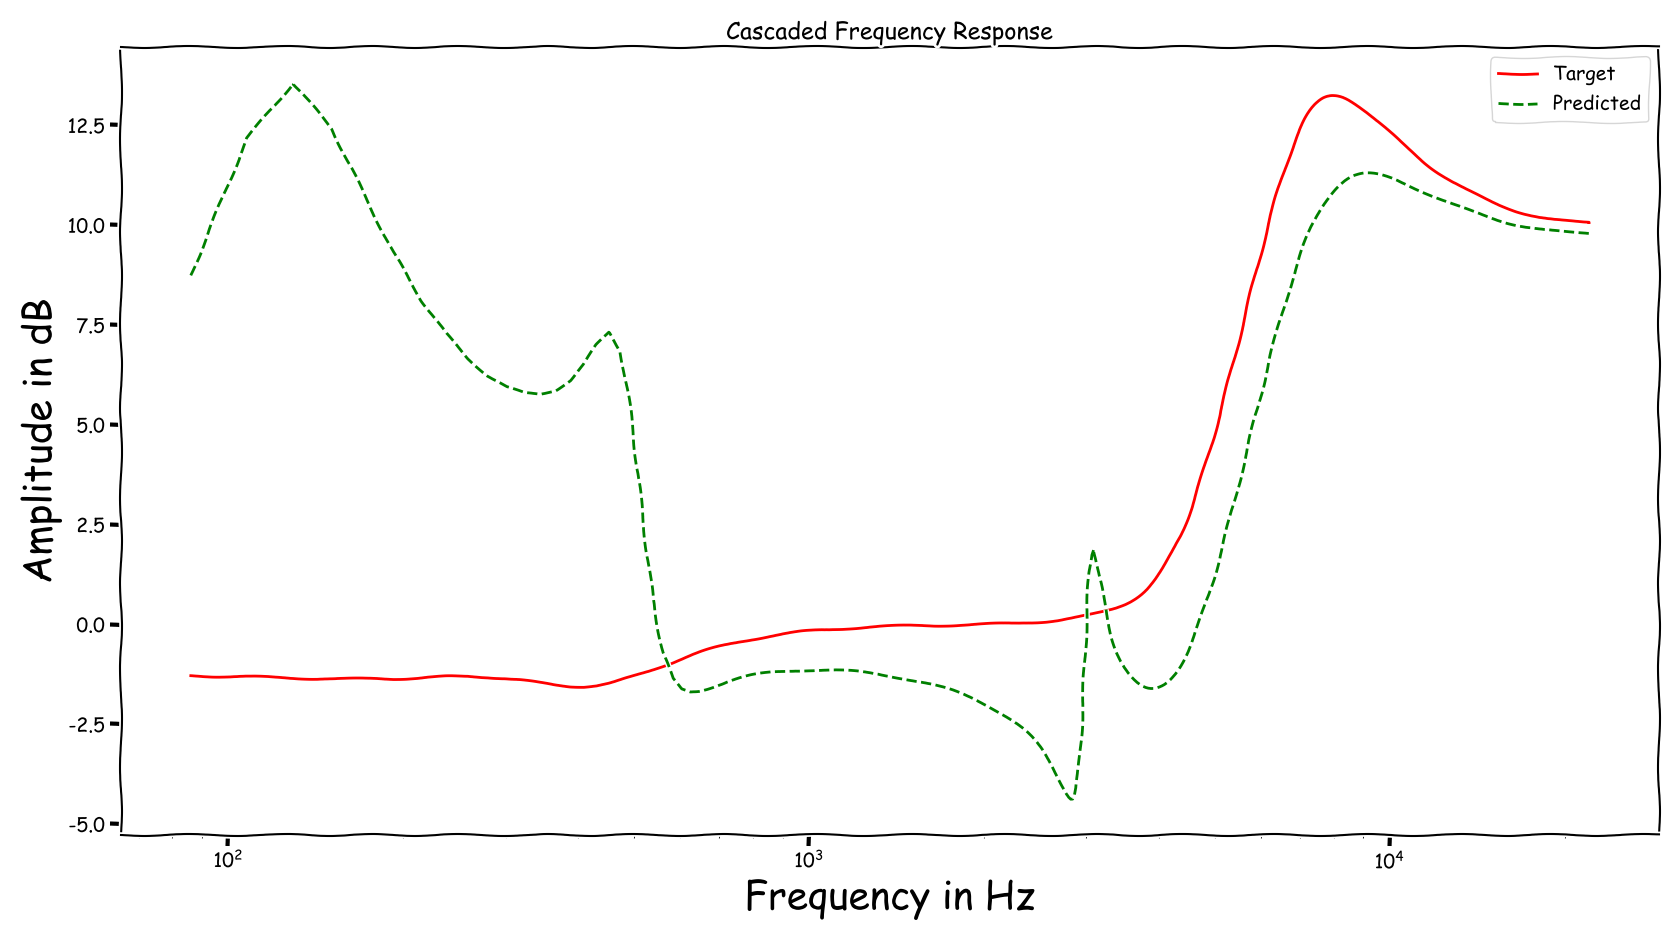
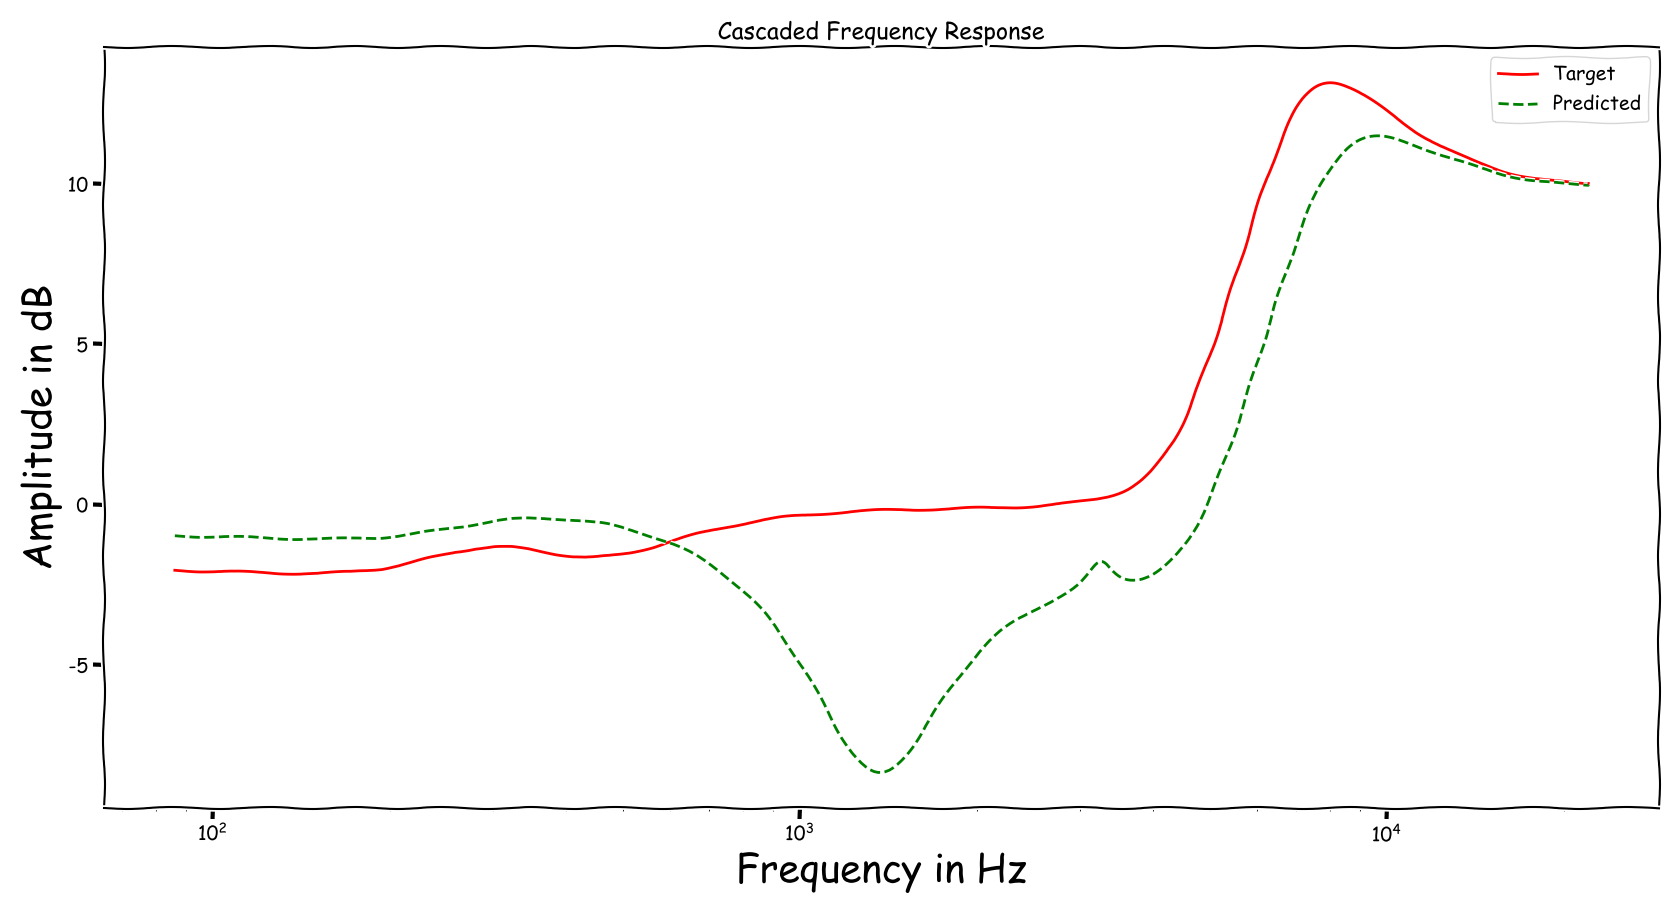
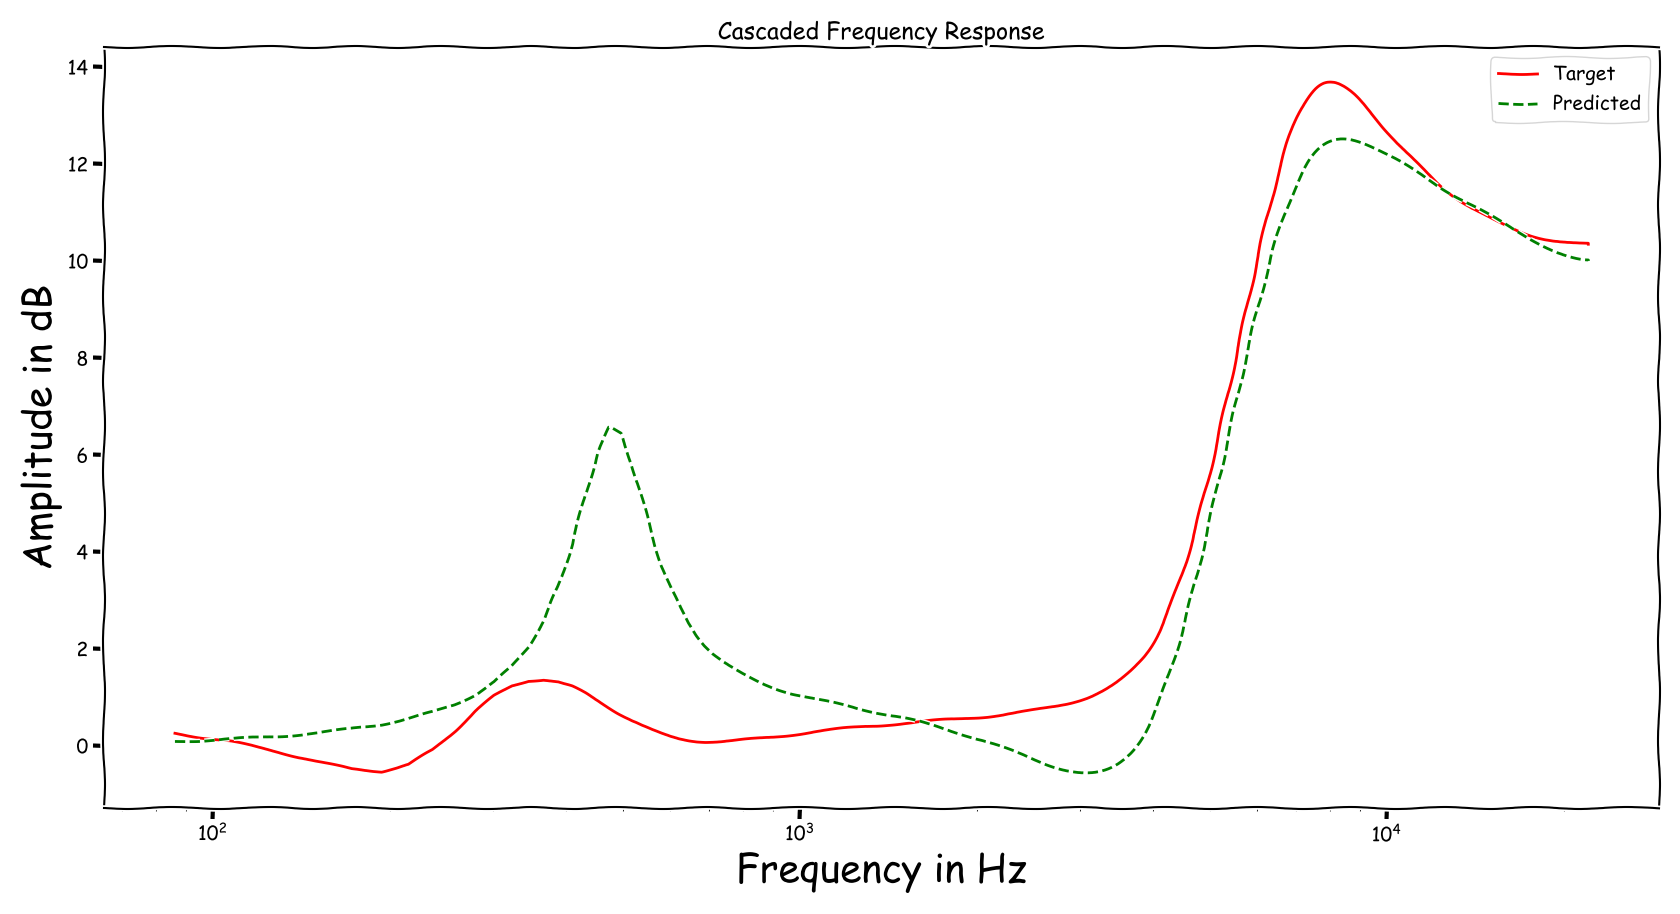
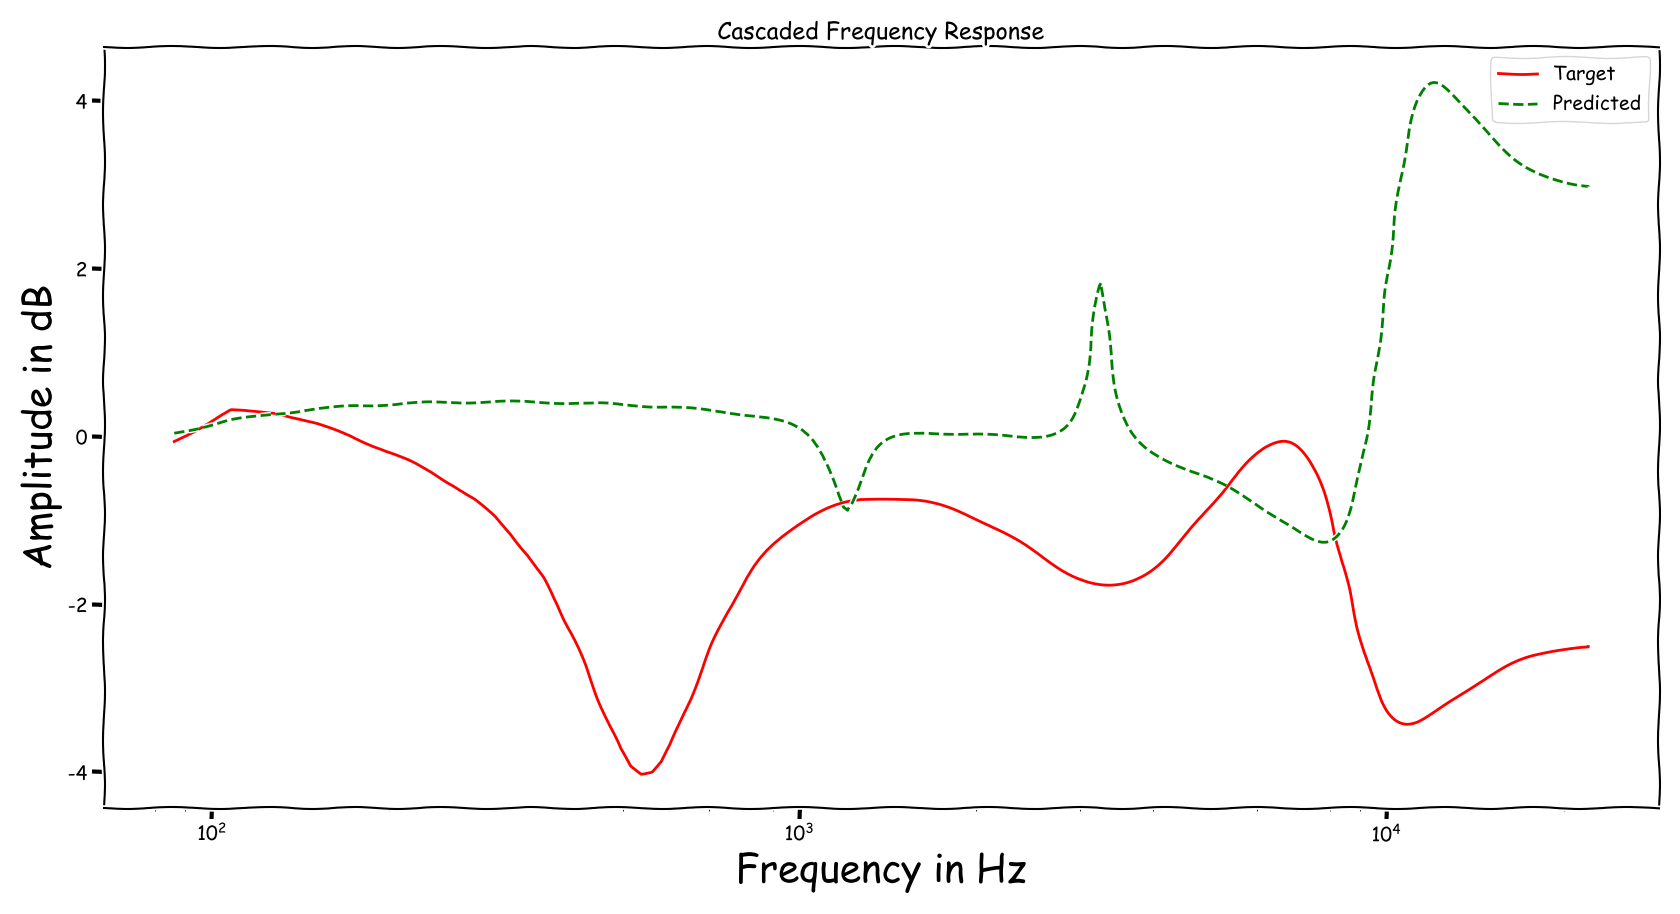
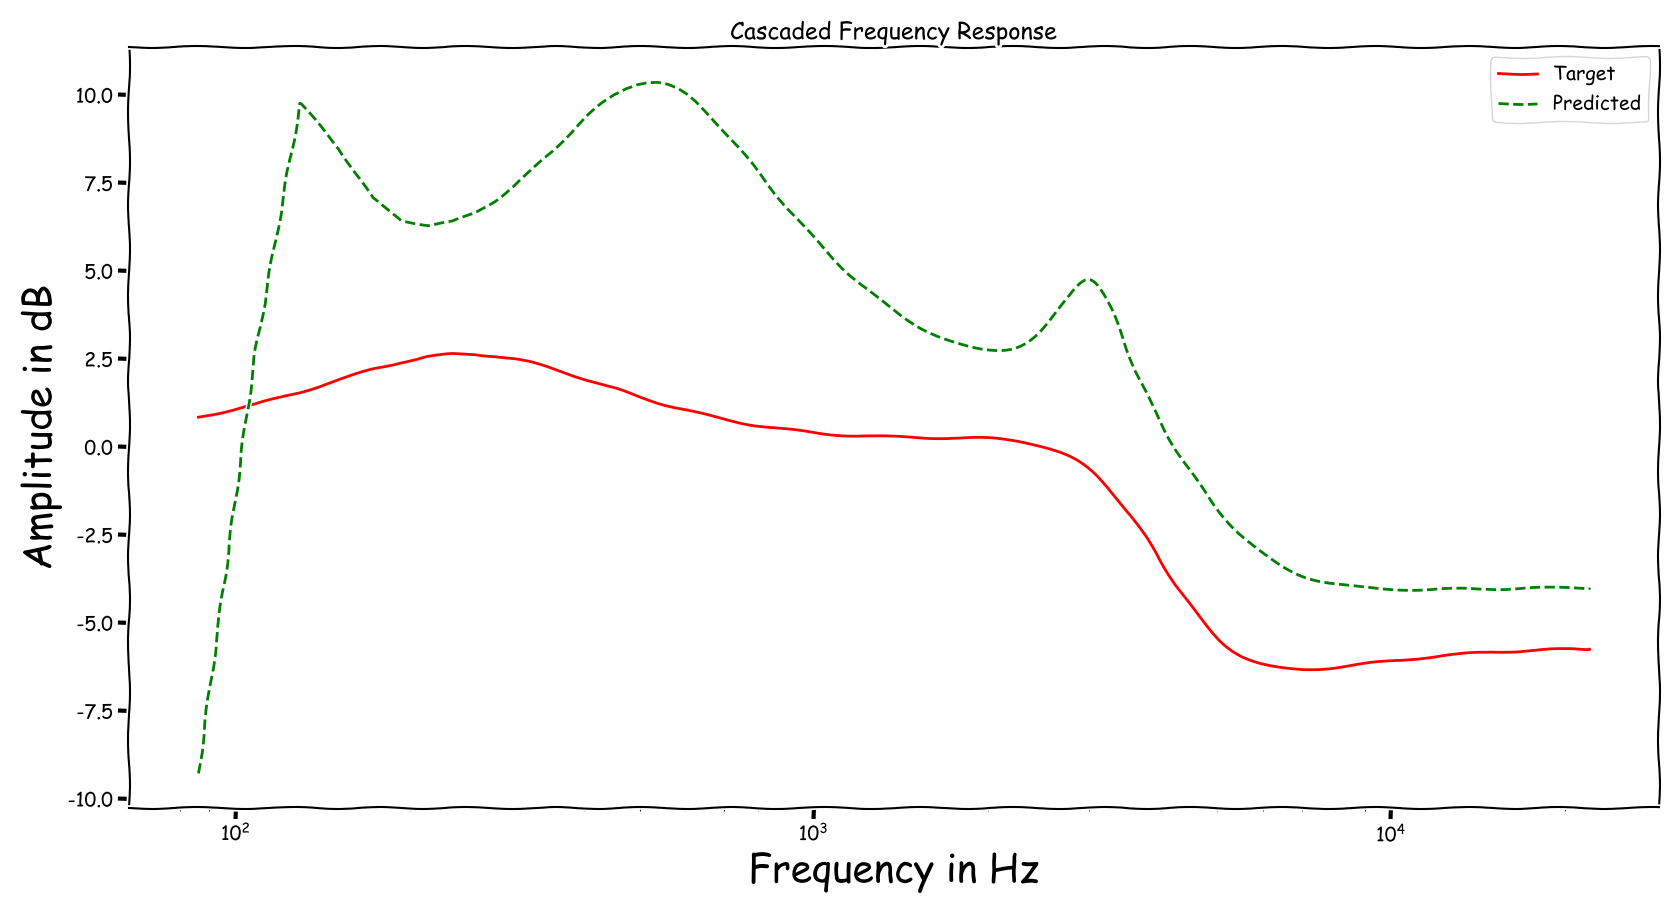
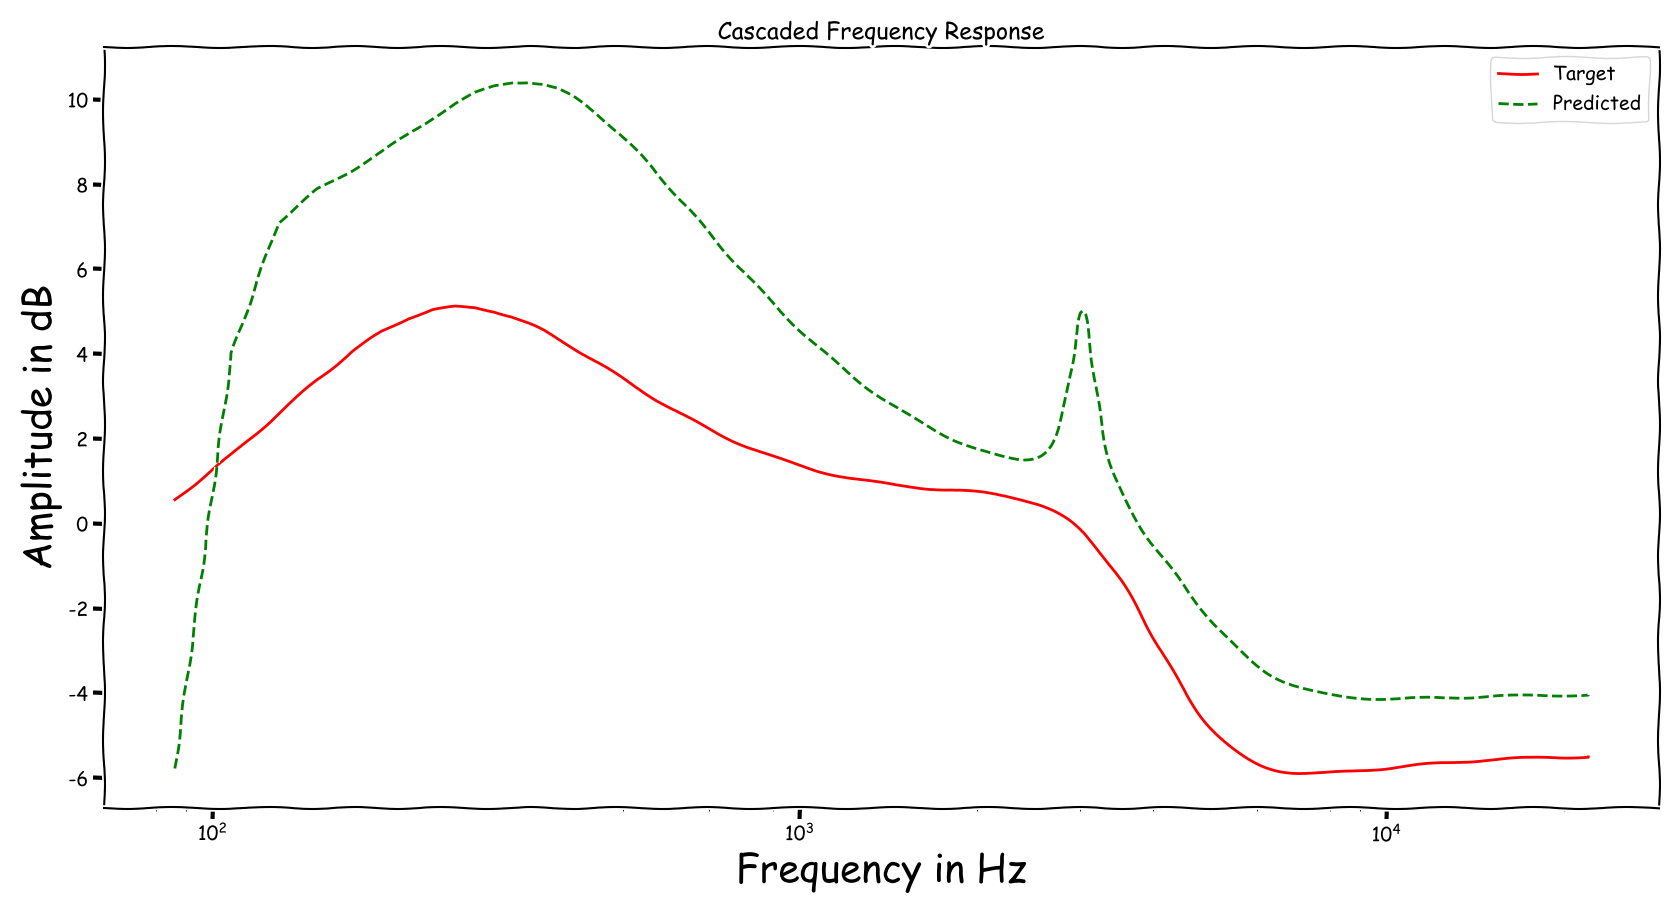
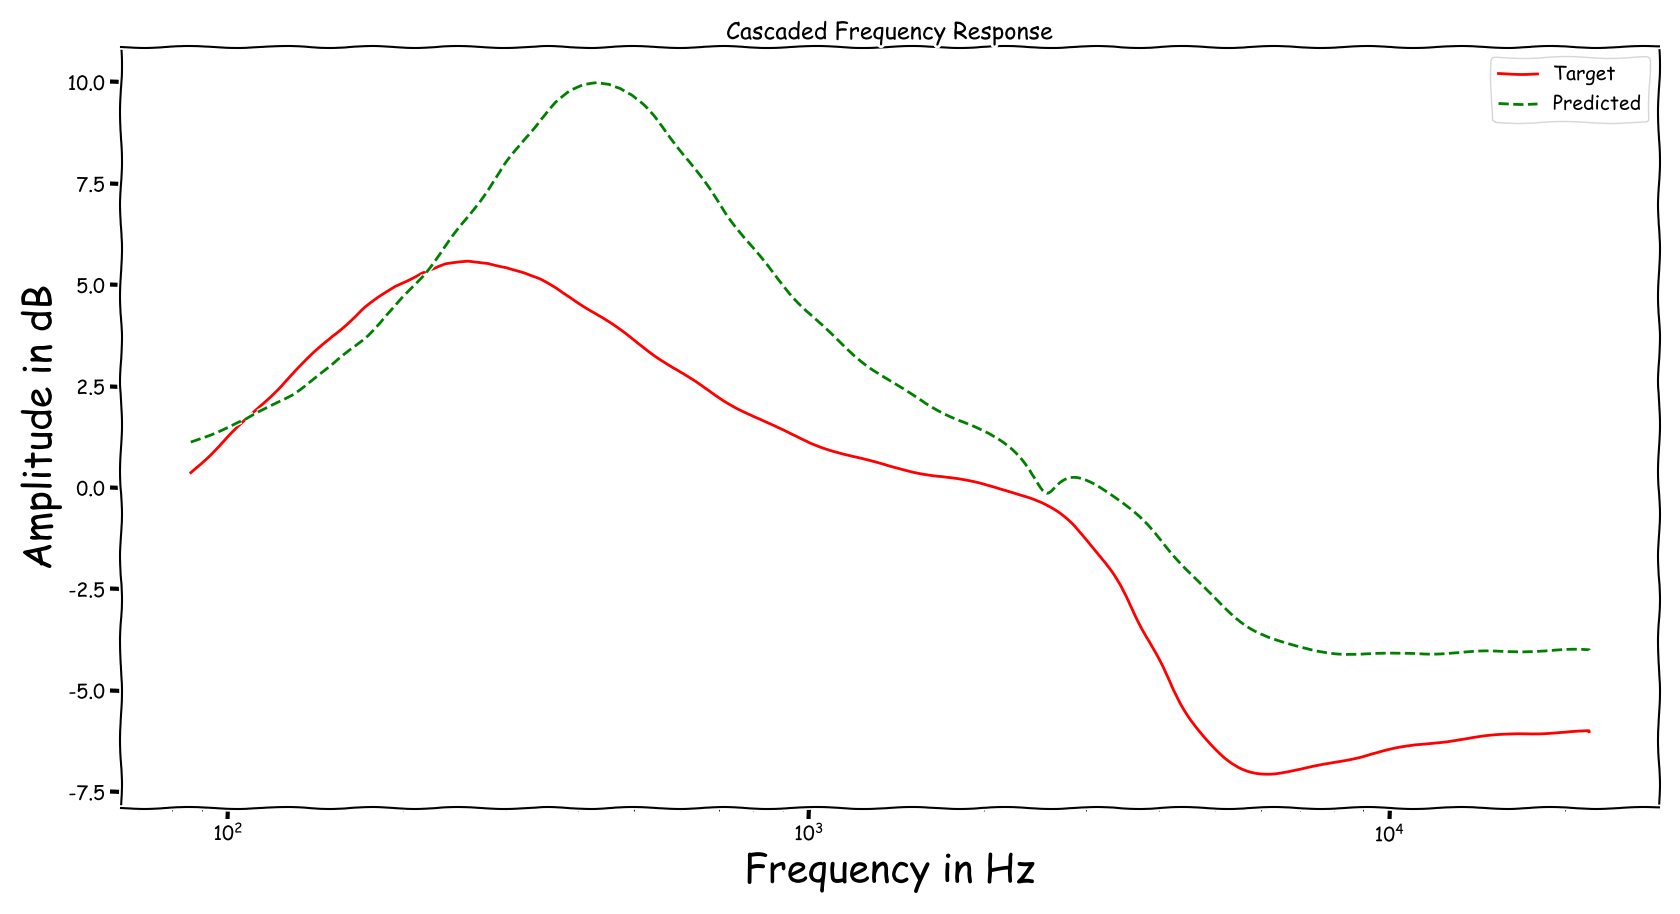
Frequency Responses
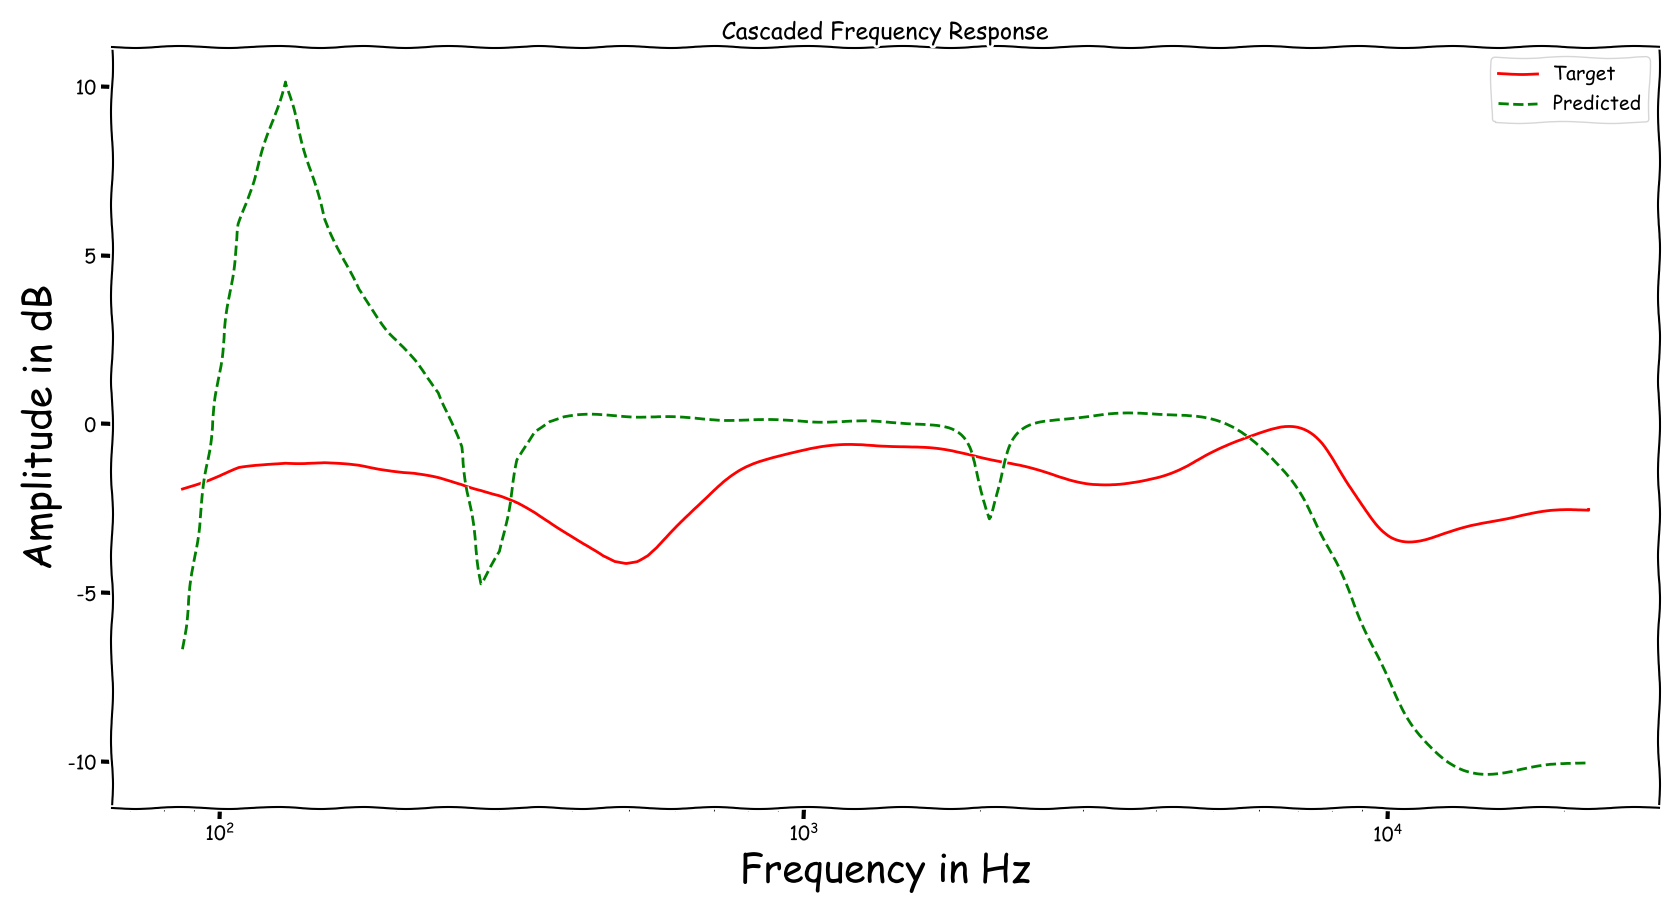
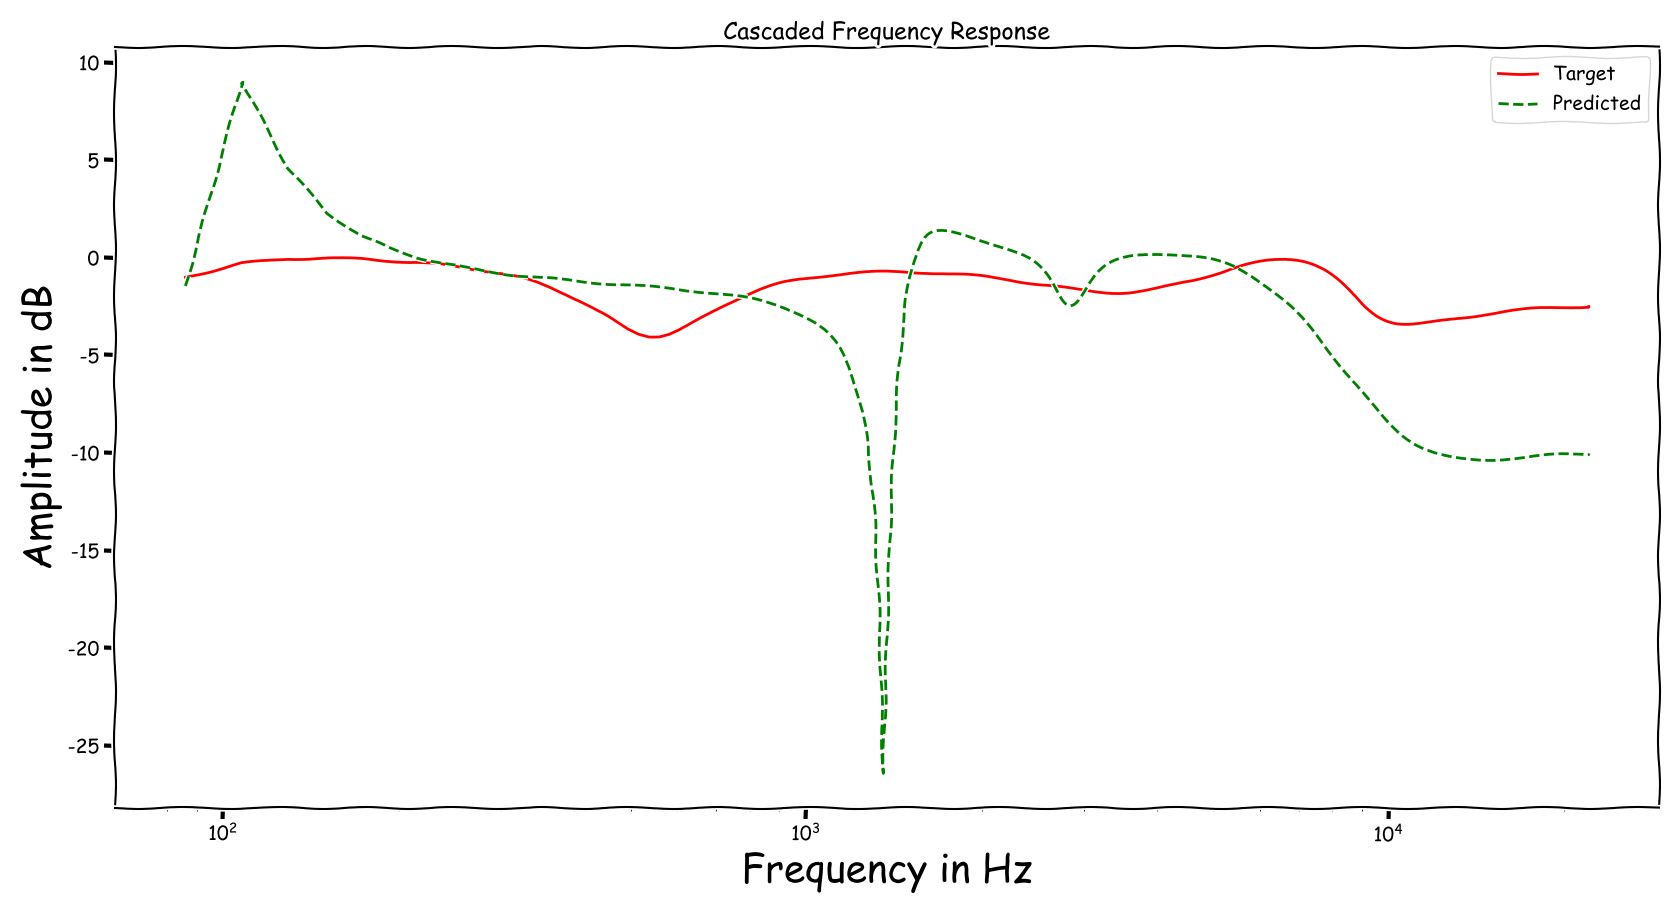
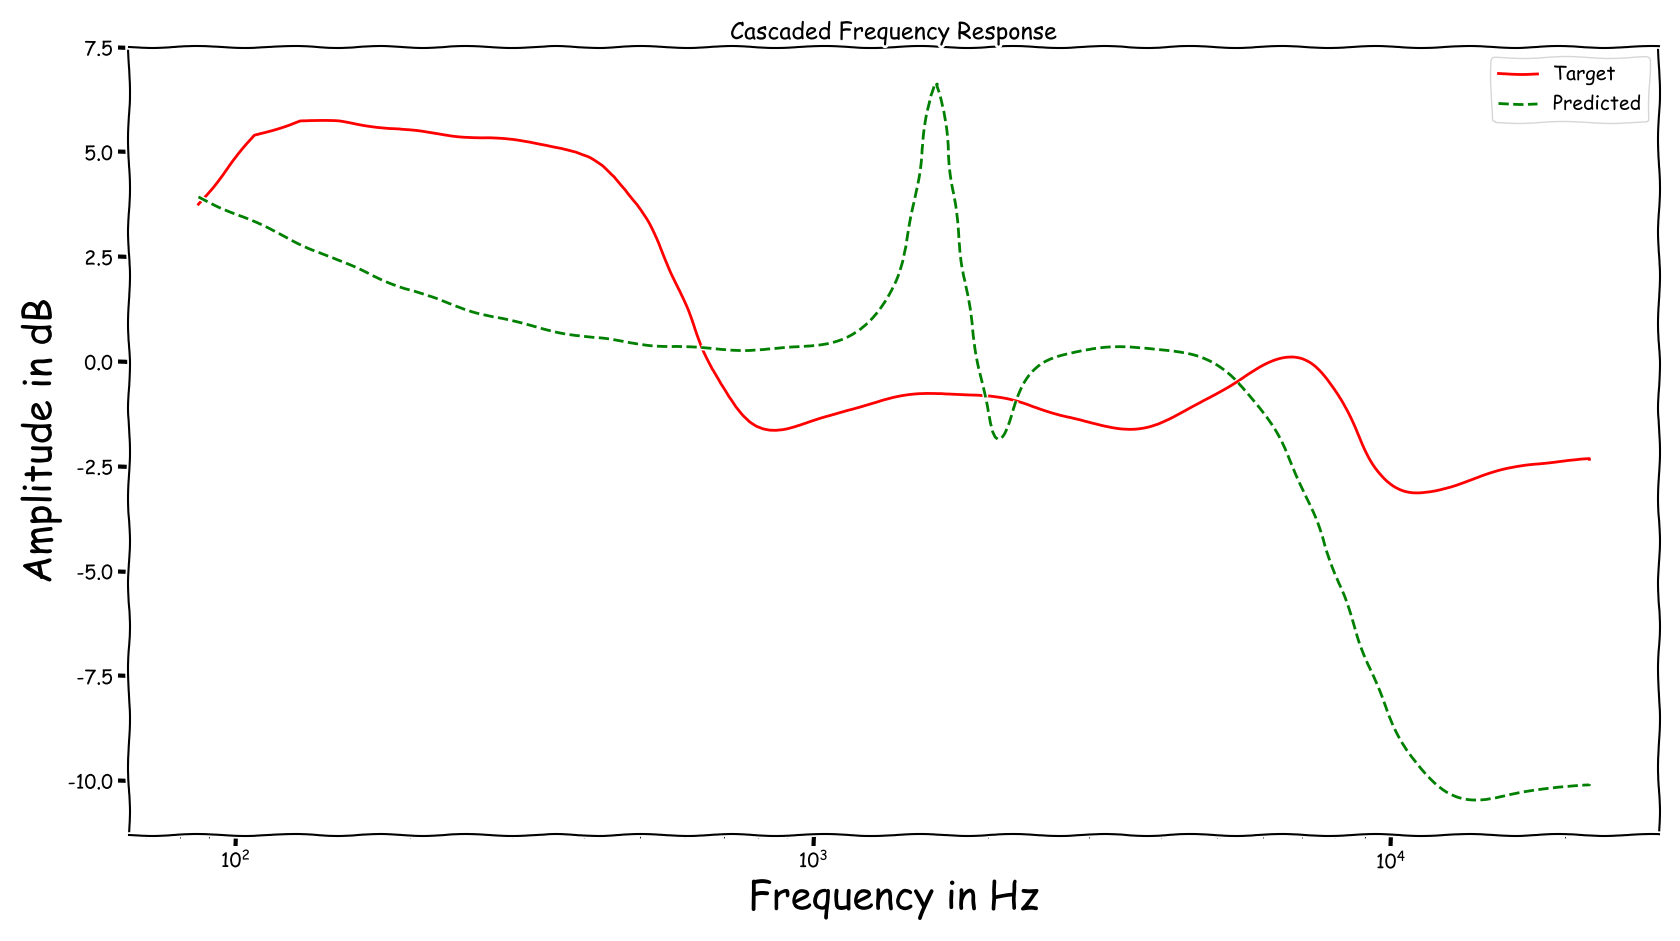
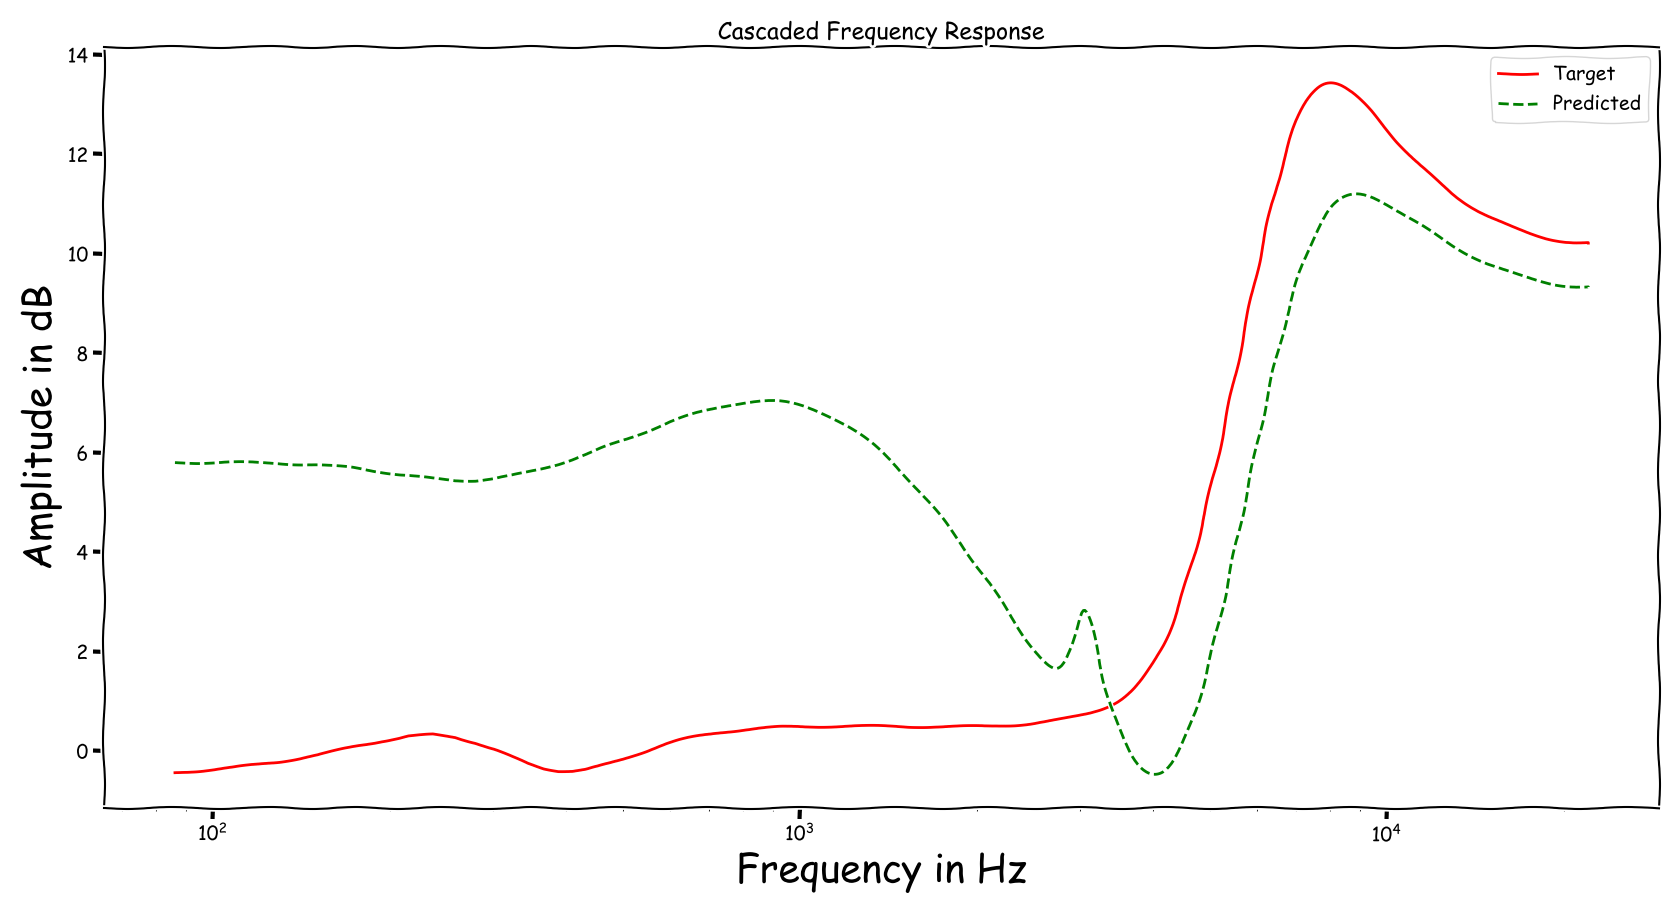
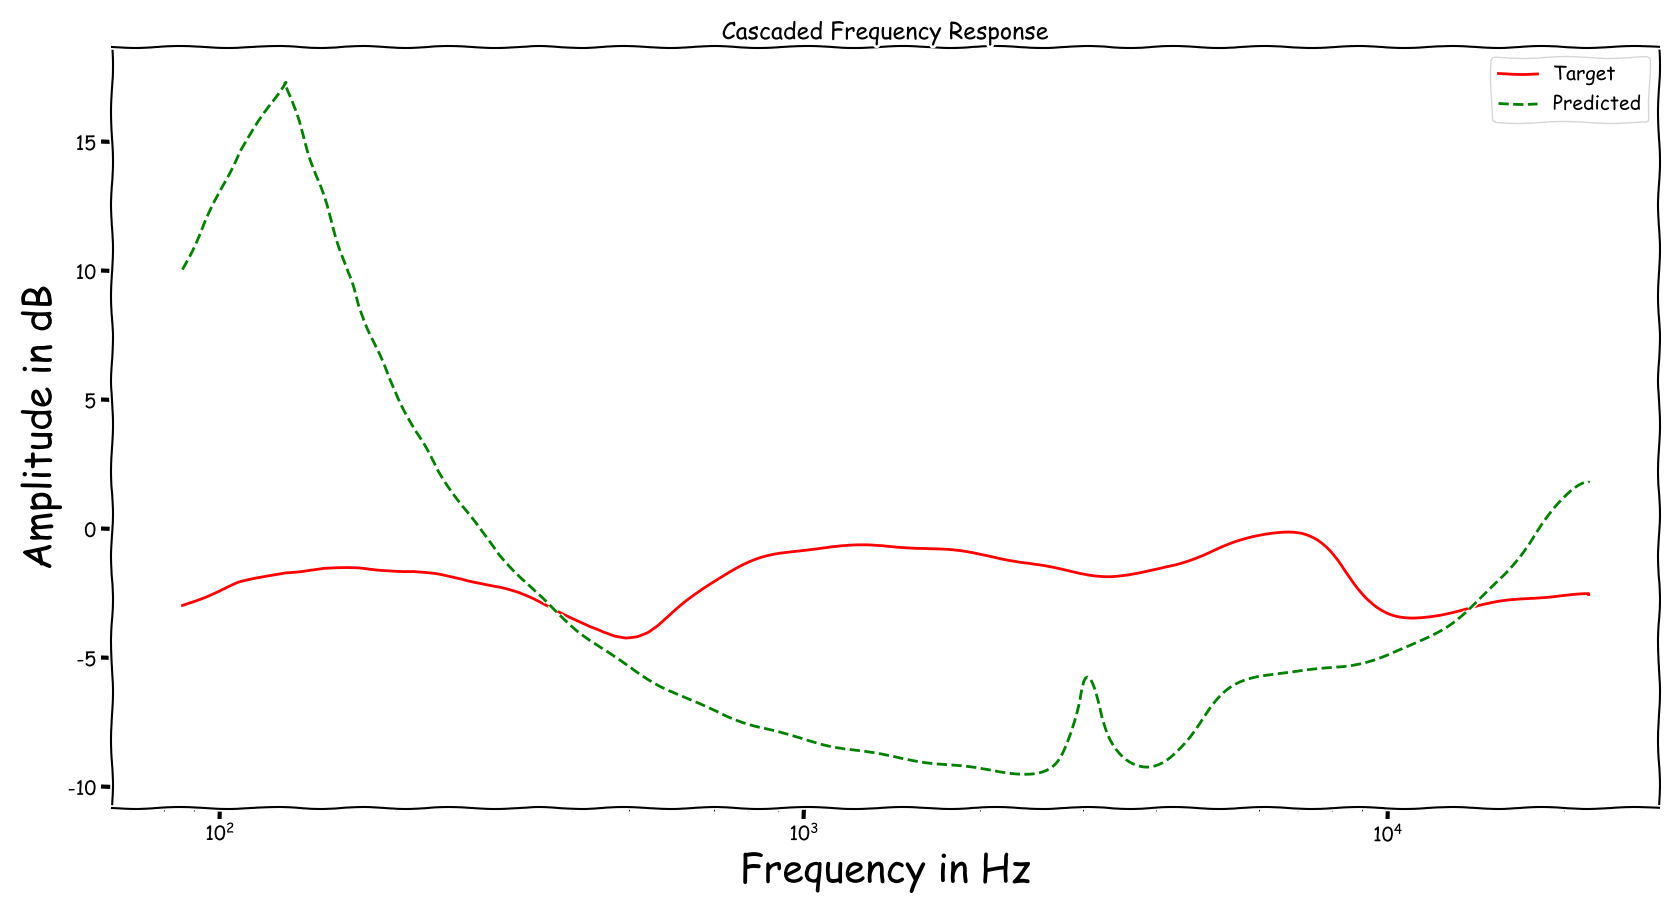
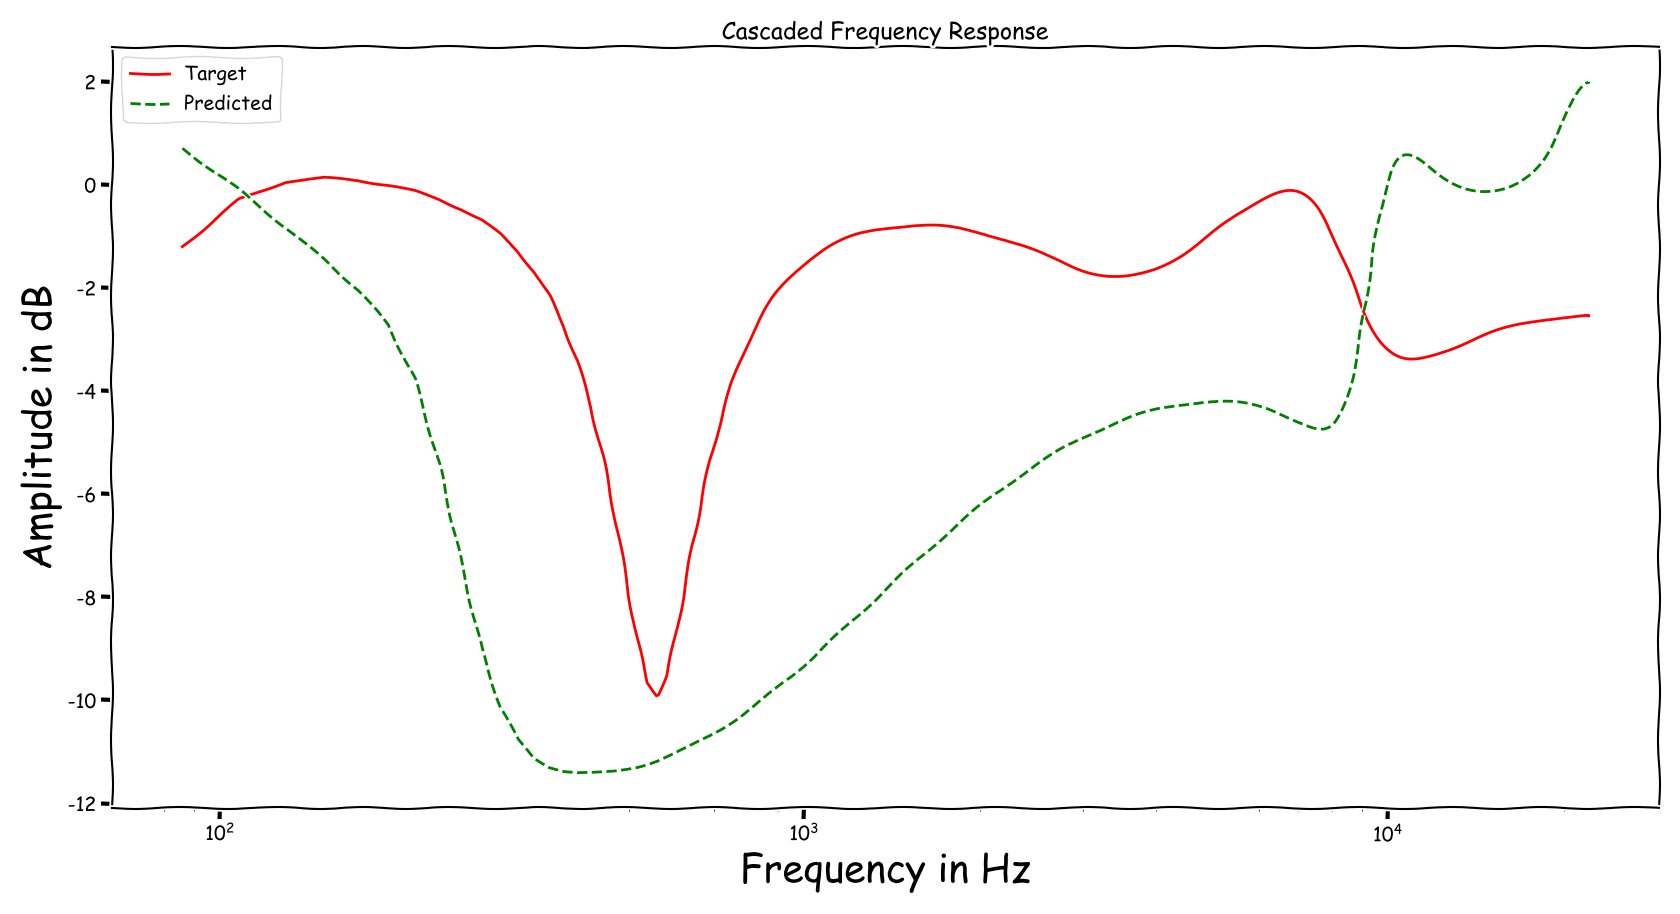
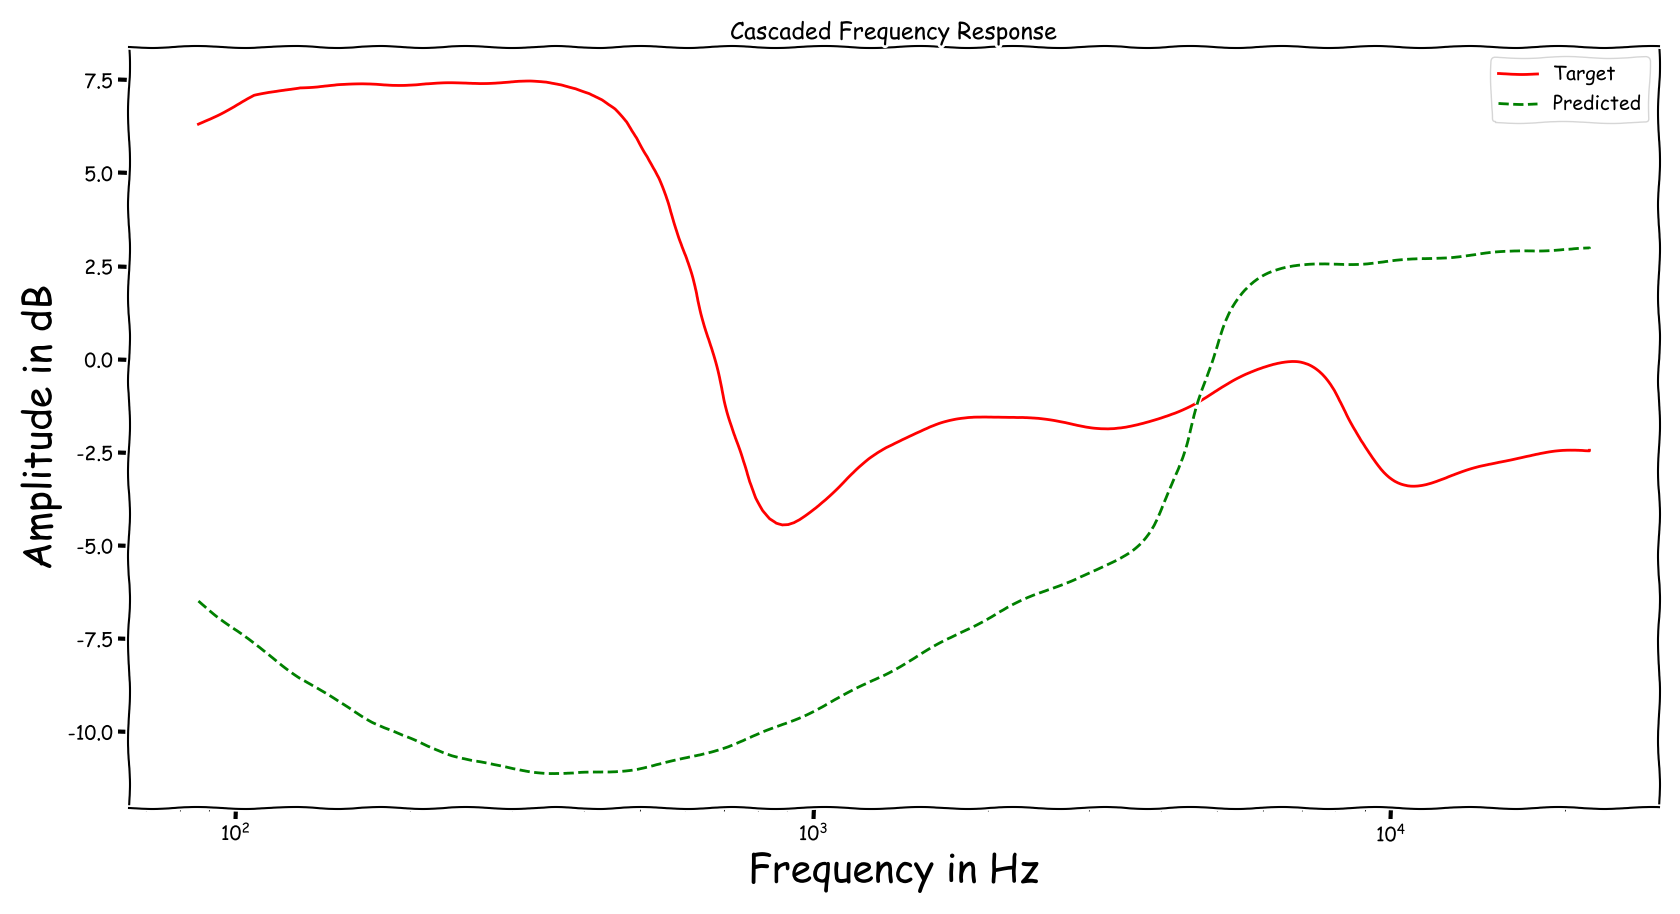
Using speech signals from test sub-set we compute a couple frequency responses for the ideal and predicted EQ parameters. The generation of the EQ parameters is random, following the reported experimental setup. These examples are illustrative for the inspection of the proposed method.
Example 1
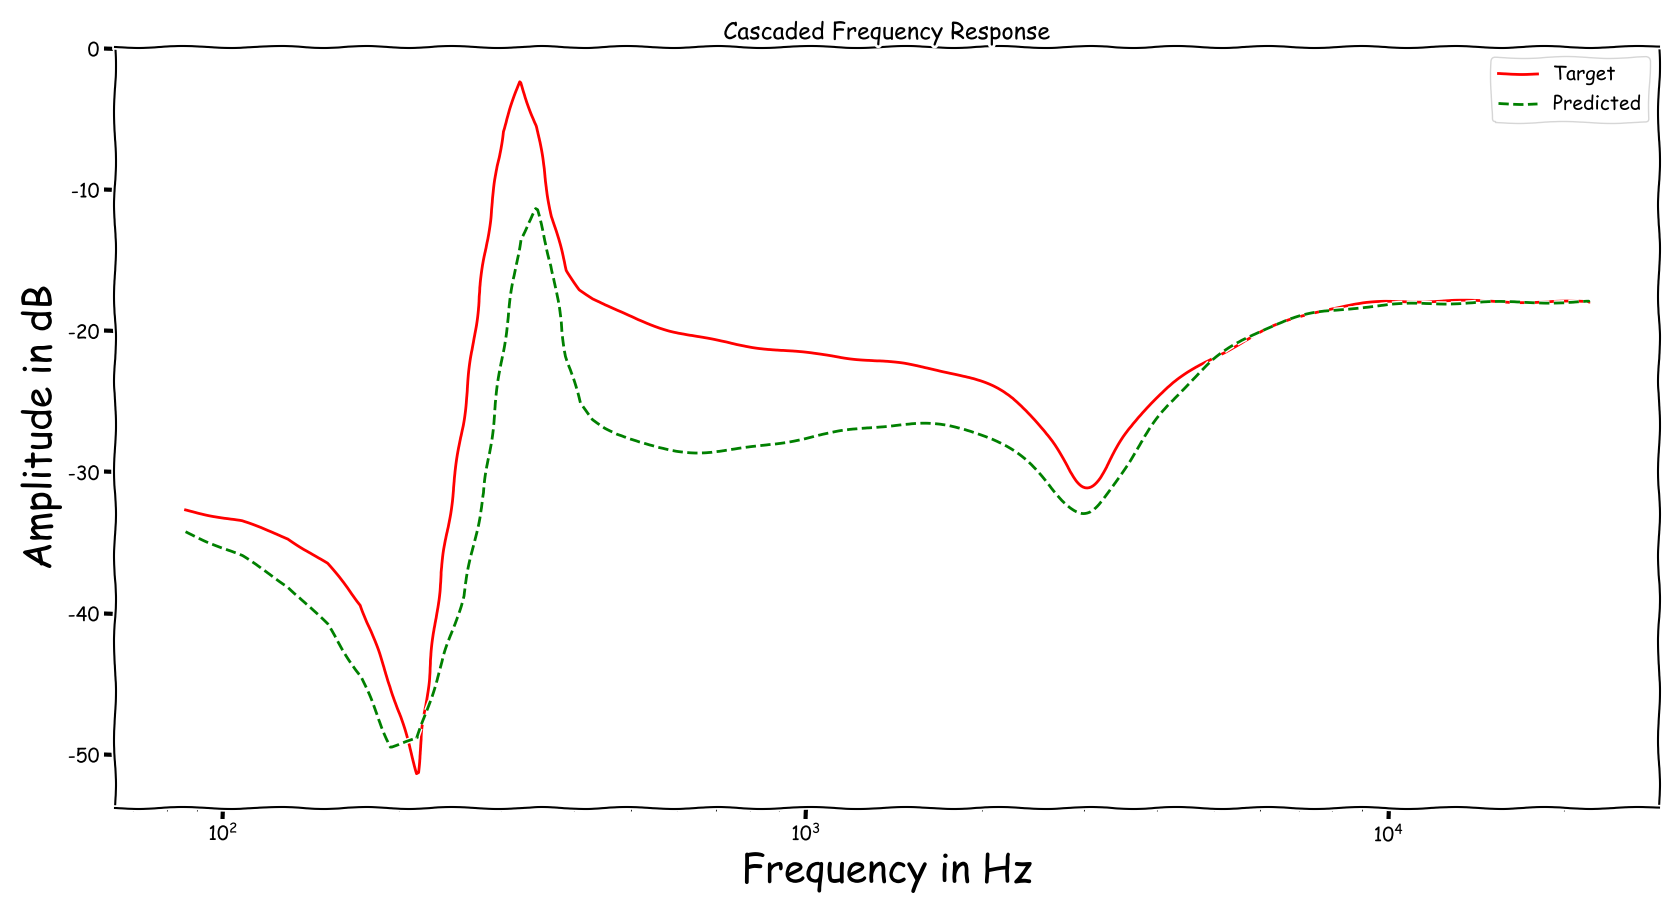
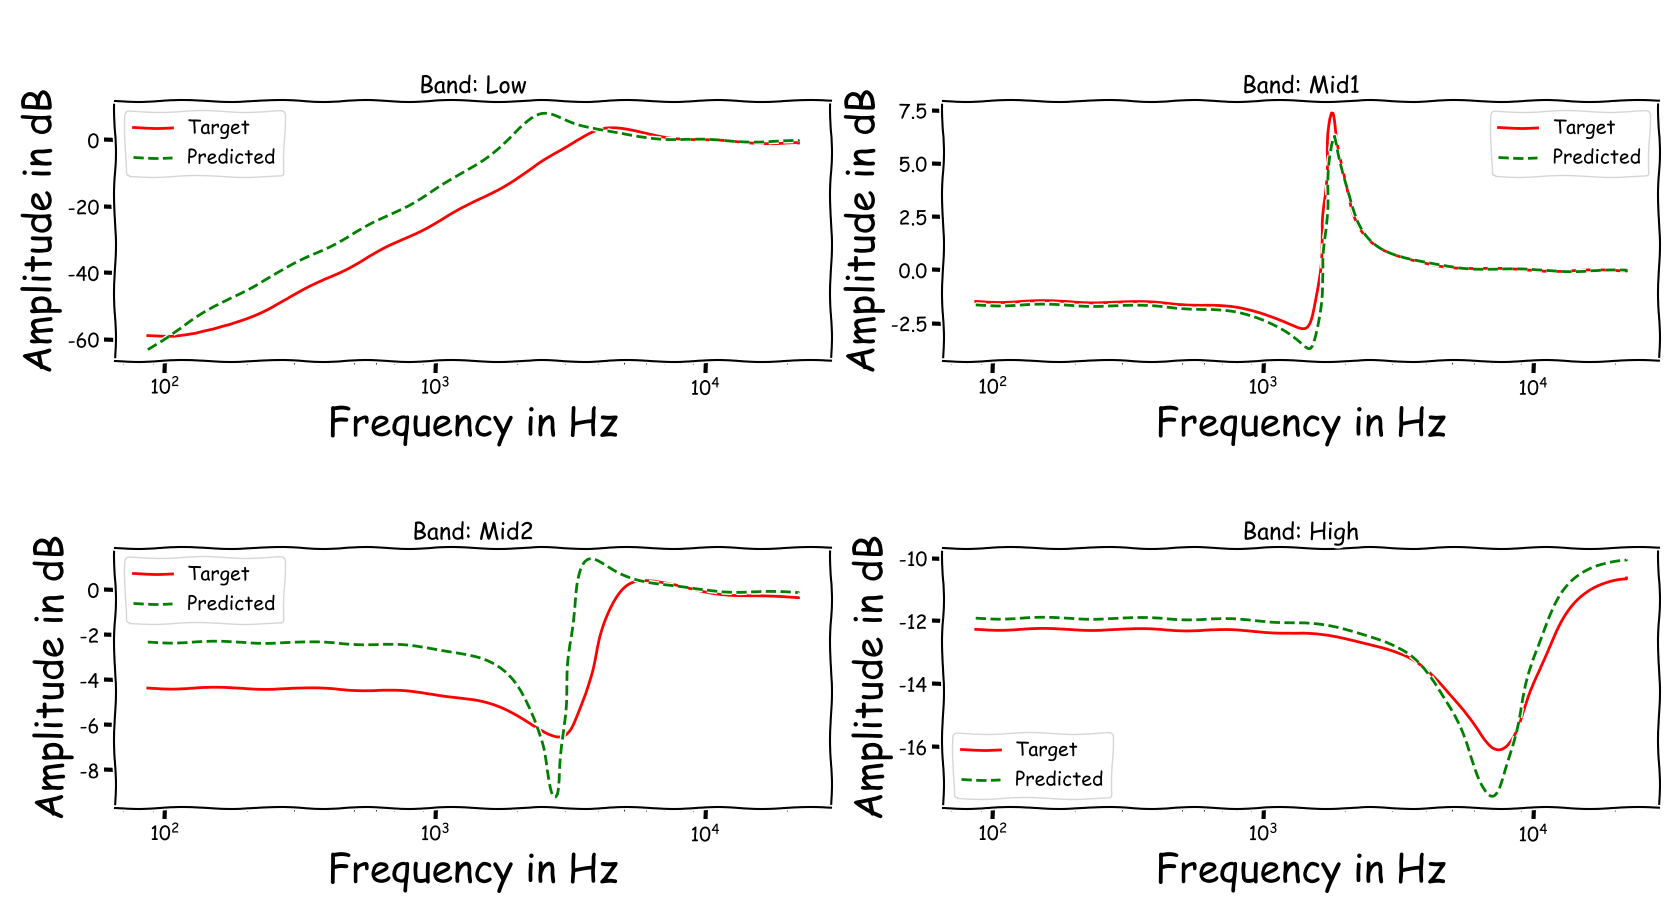
Example 2
Example 3
Example 4
Example 5
Example 6
Example 7
Audio Examples
Audio examples using data-points from the test sub-set. The goal is to match the EQ/spectral characteristics of the input signal to the reference signal.
Speech Signals
| Example | Input | Reference | Processed |
|---|---|---|---|
| Ex. 1 | |||
| Ex. 2 | |||
| Ex. 3 | |||
| Ex. 4 | |||
| Ex. 5 | |||
| Ex. 6 | |||
| Ex. 7 | |||
| Ex. 8 | |||
| Ex. 9 | |||
| Ex. 10 |
Music Signals
The tests on music signals were simply performed by using the proposed method, that was trained on speech signals of 3 seconds, with variable length excerpts, i.e., no re-training or any additional routines were considered. The music signals were acquired from MUSDB18. To demonstrate the variability of the predicted EQ settings, we consider neighbouring music excerpts as examples and we also swap between what our proposed method considers as input and what was reference.
| Example | Input | Reference | Processed |
|---|---|---|---|
| Ex. 1 | |||
| Ex. 2 | |||
| Ex. 3 | |||
| Ex. 4 | |||
| Ex. 5 | |||
| Ex. 6 | |||
| Ex. 7 | |||
| Ex. 8 | |||
| Ex. 9 | |||
| Ex. 10 |
Latent Business
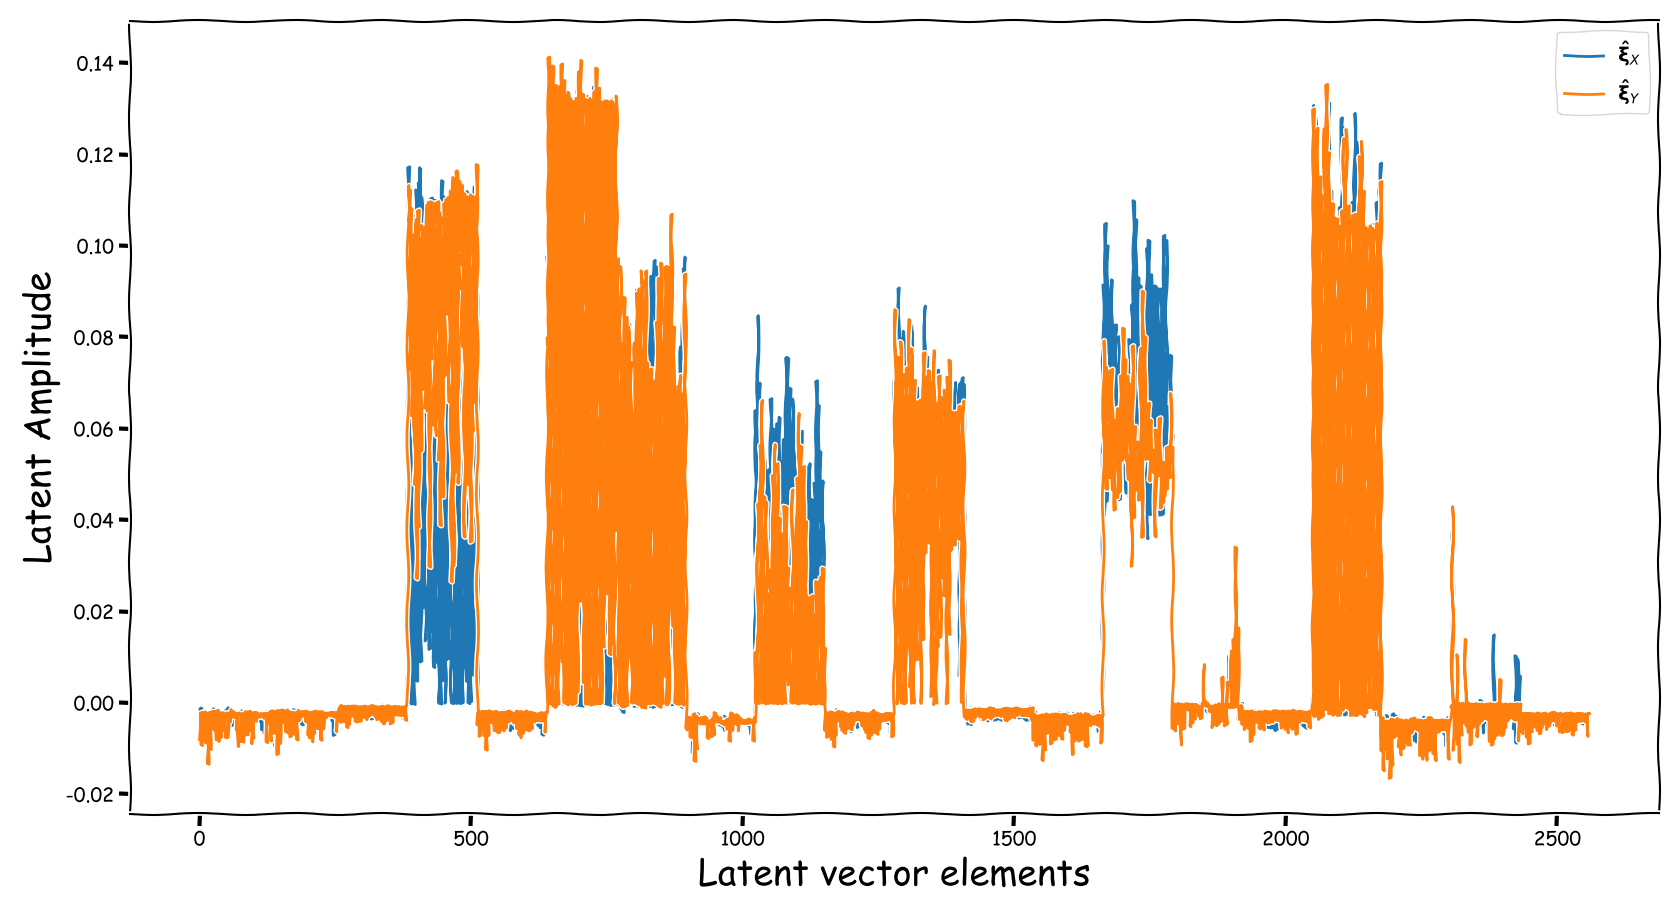
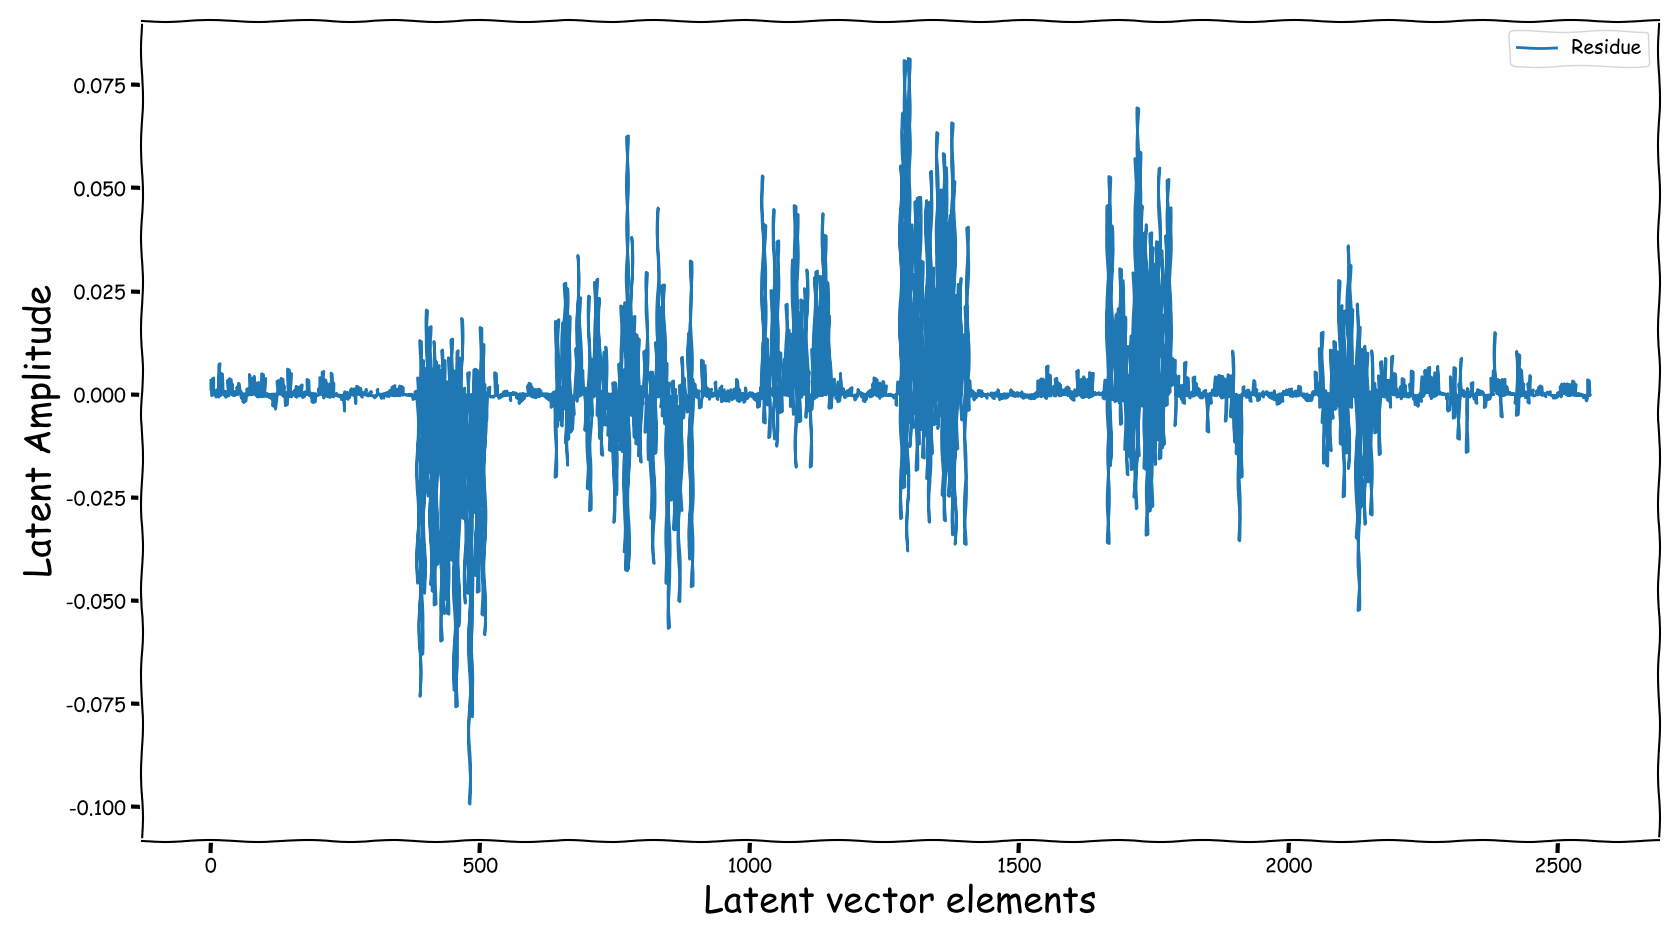
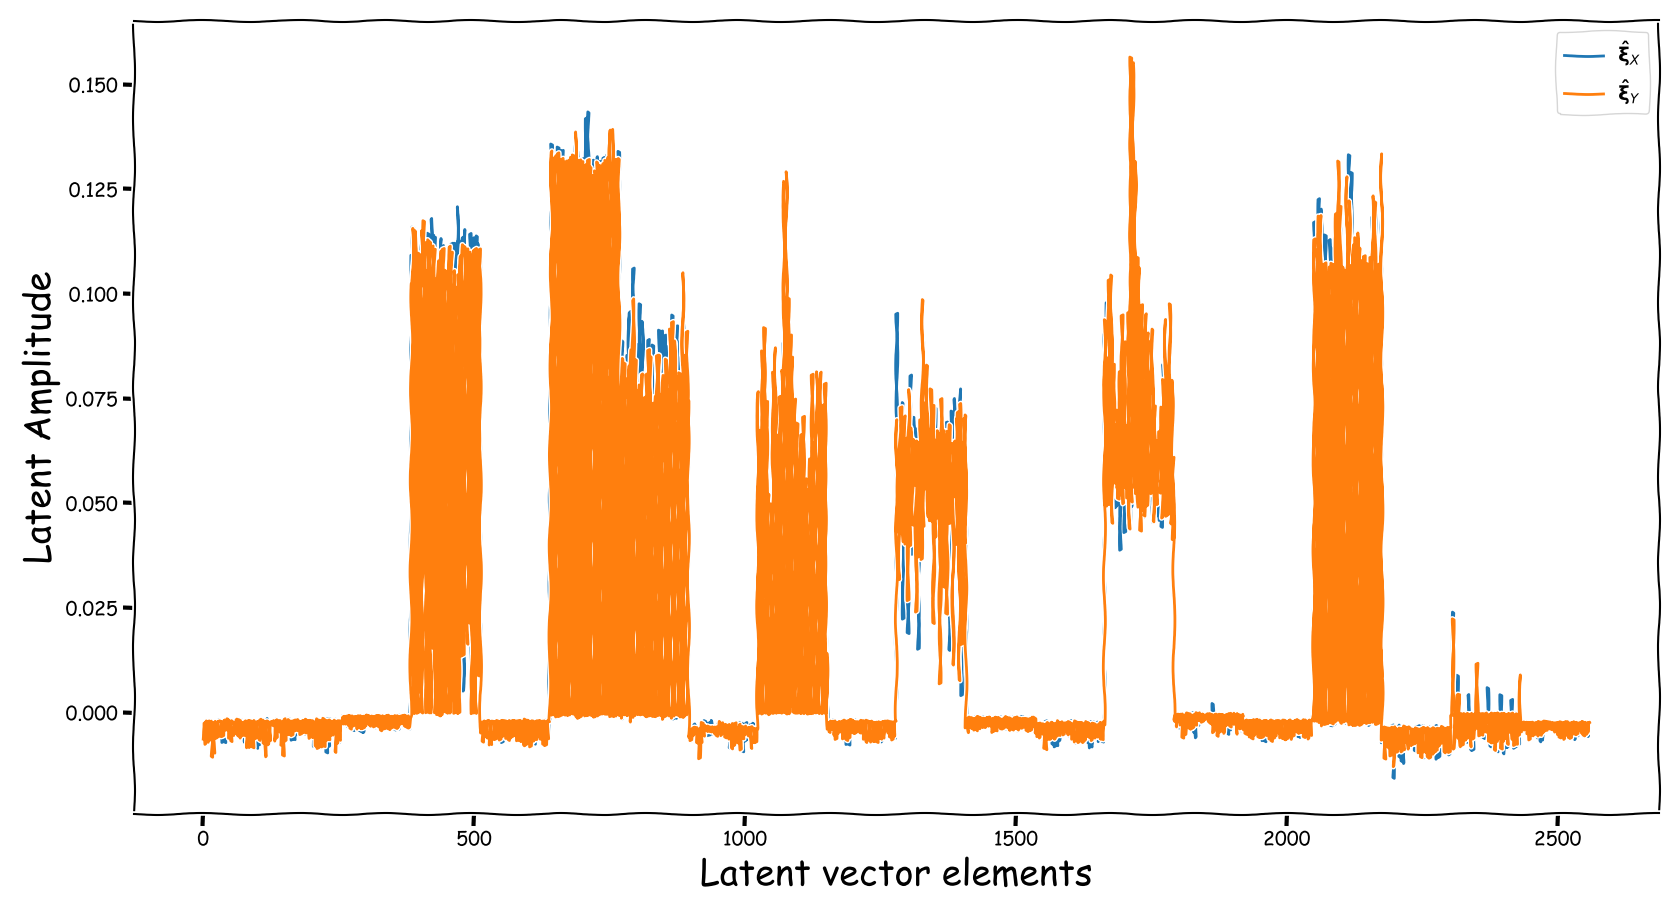
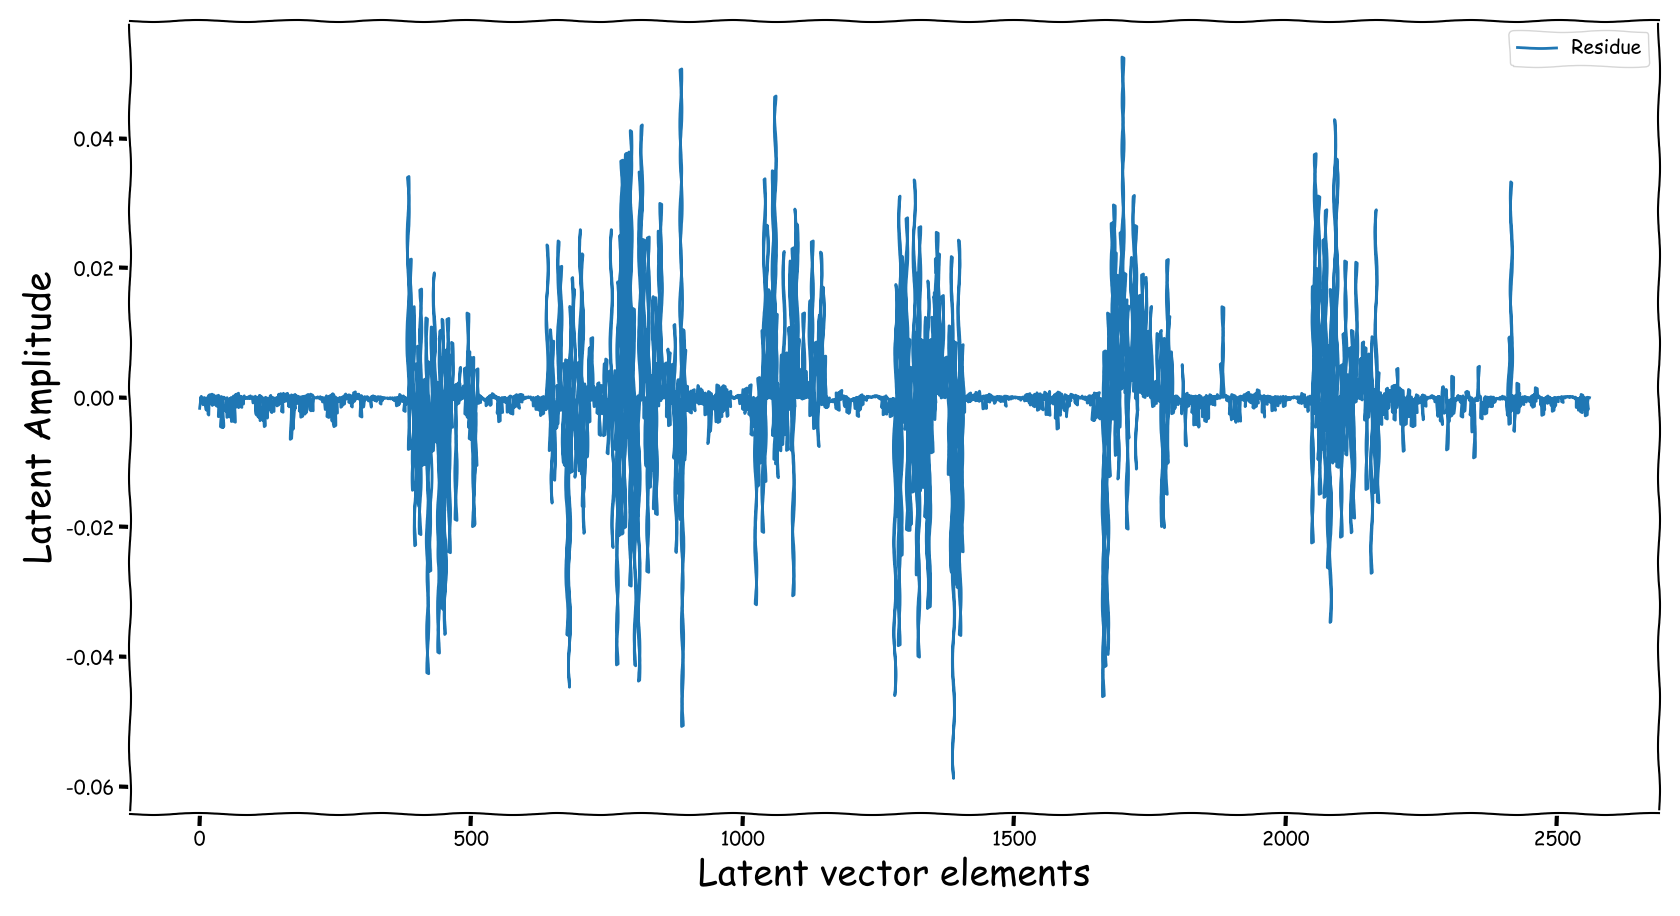
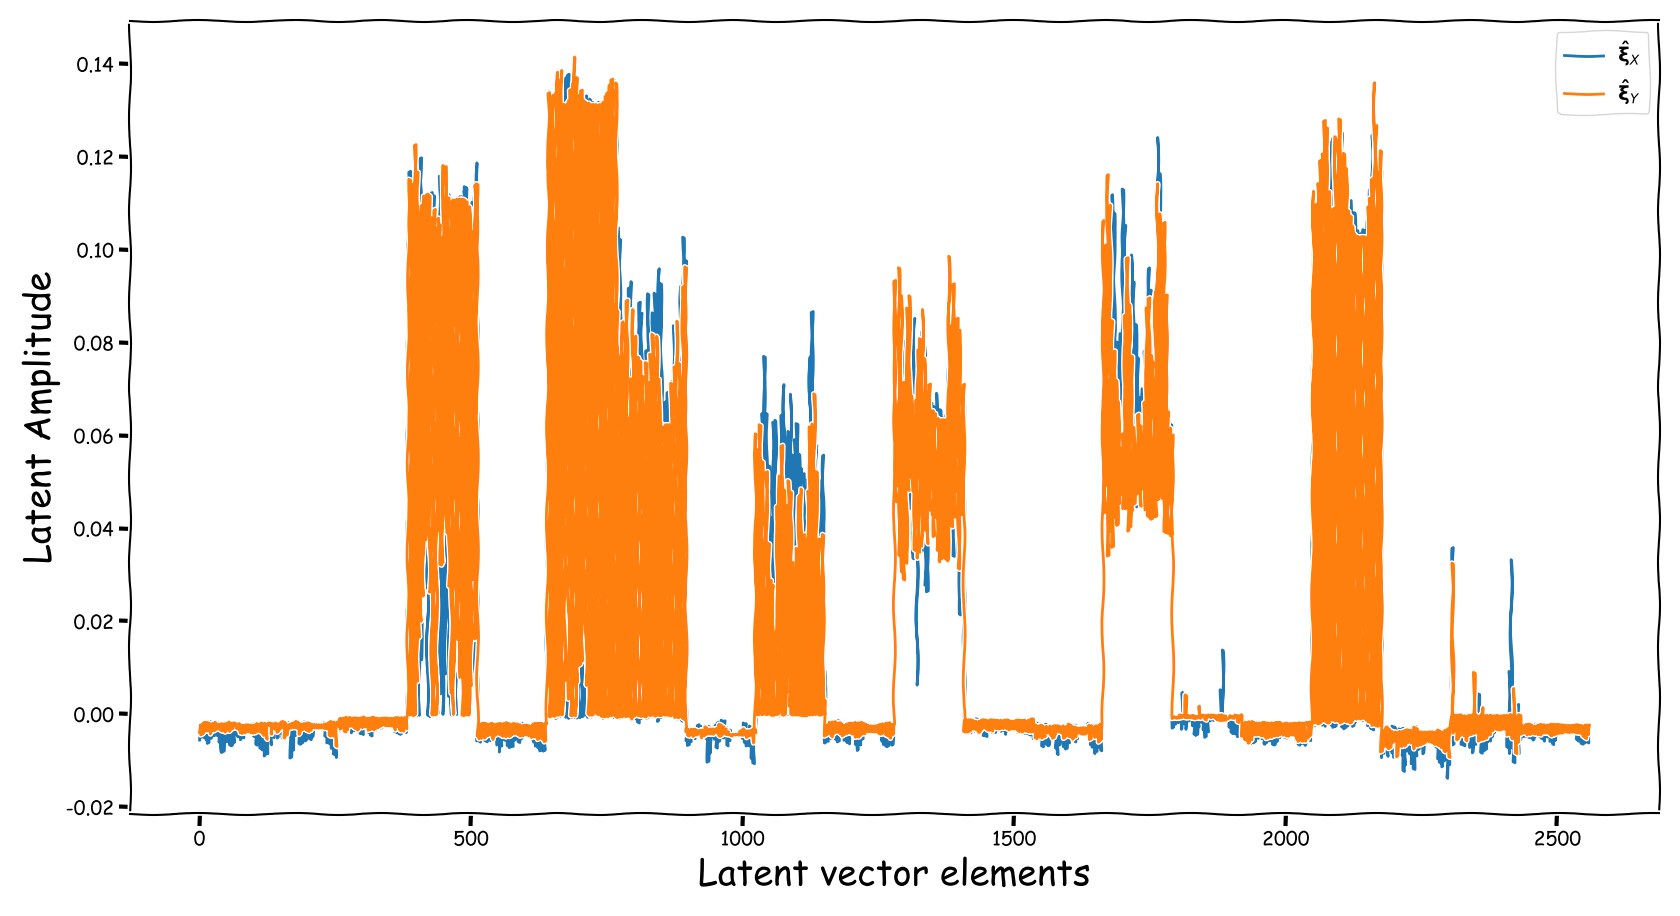
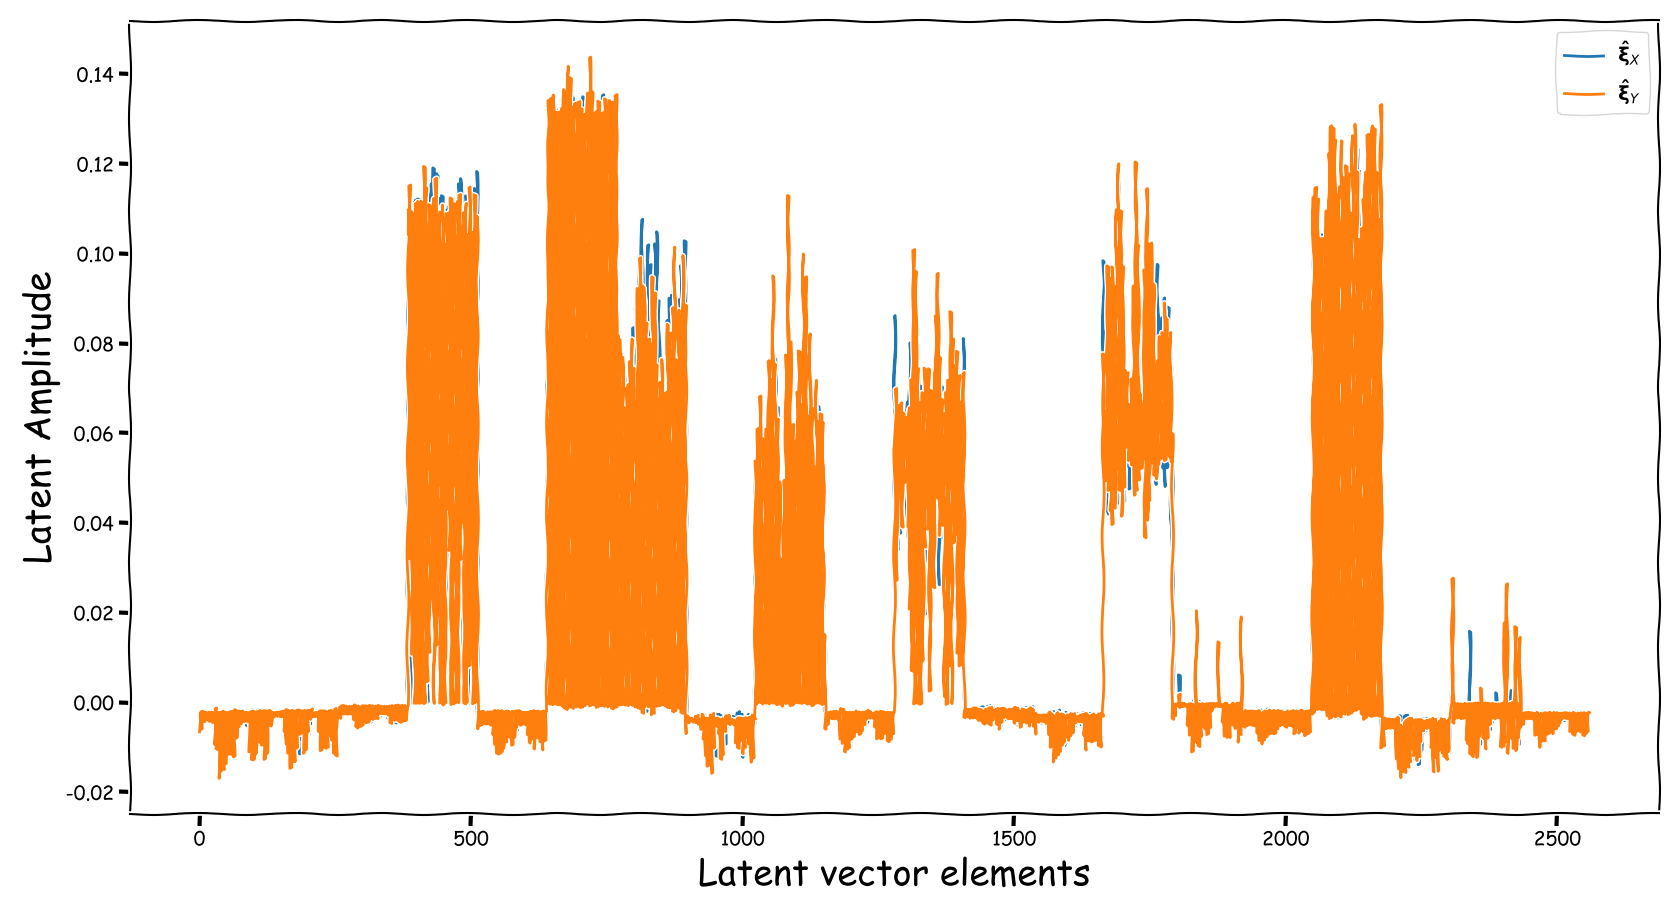
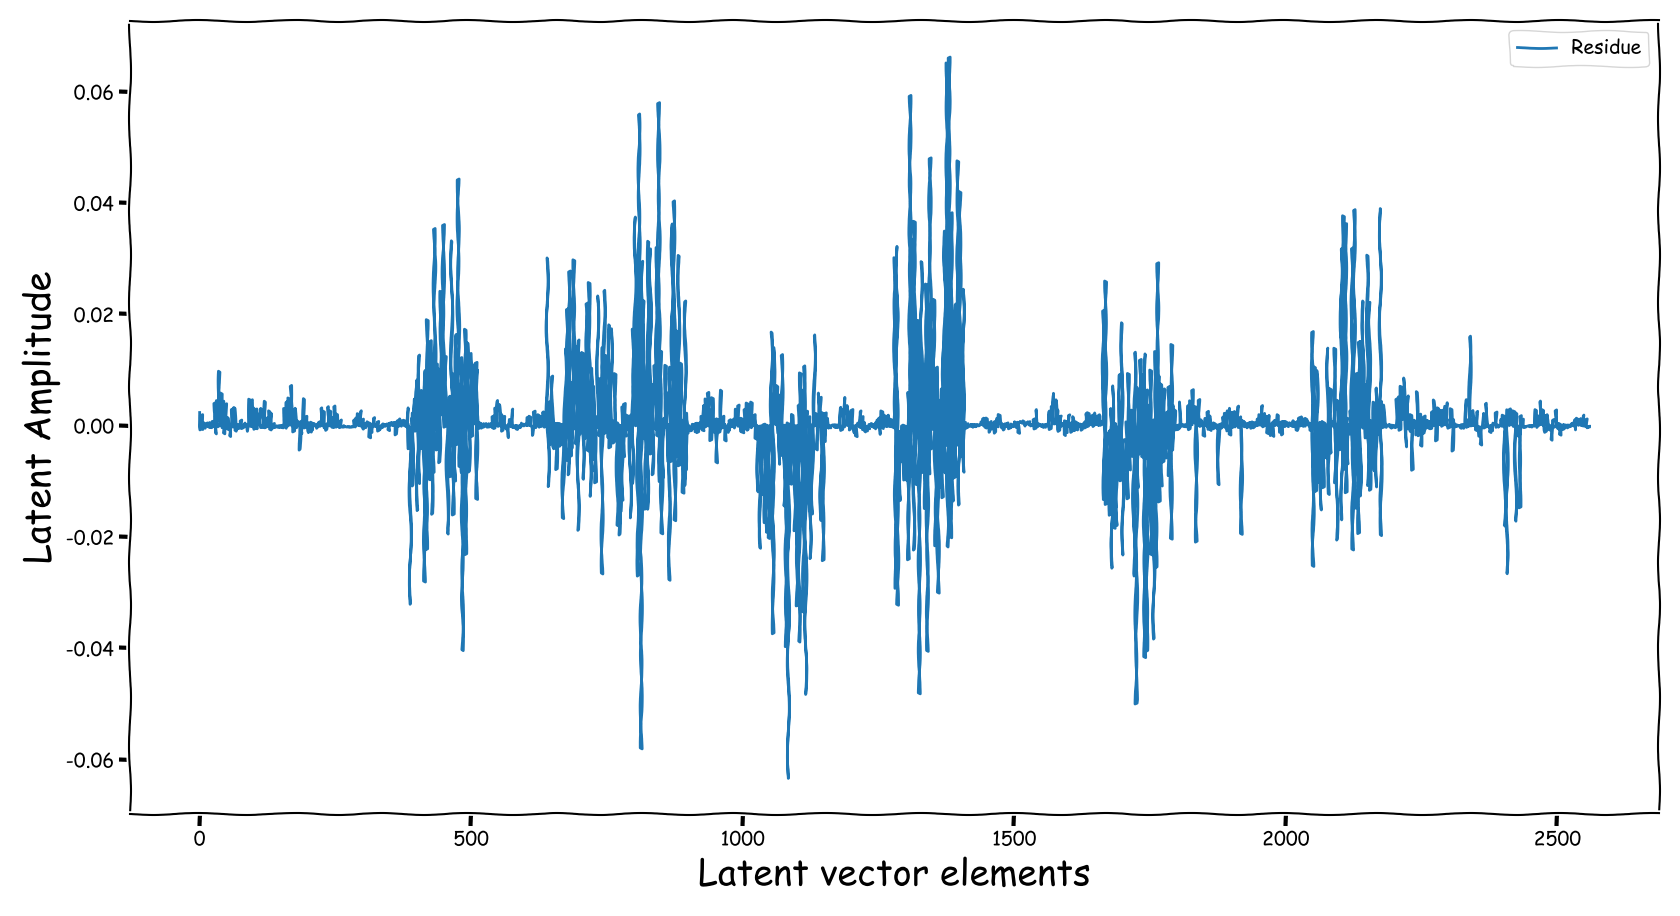
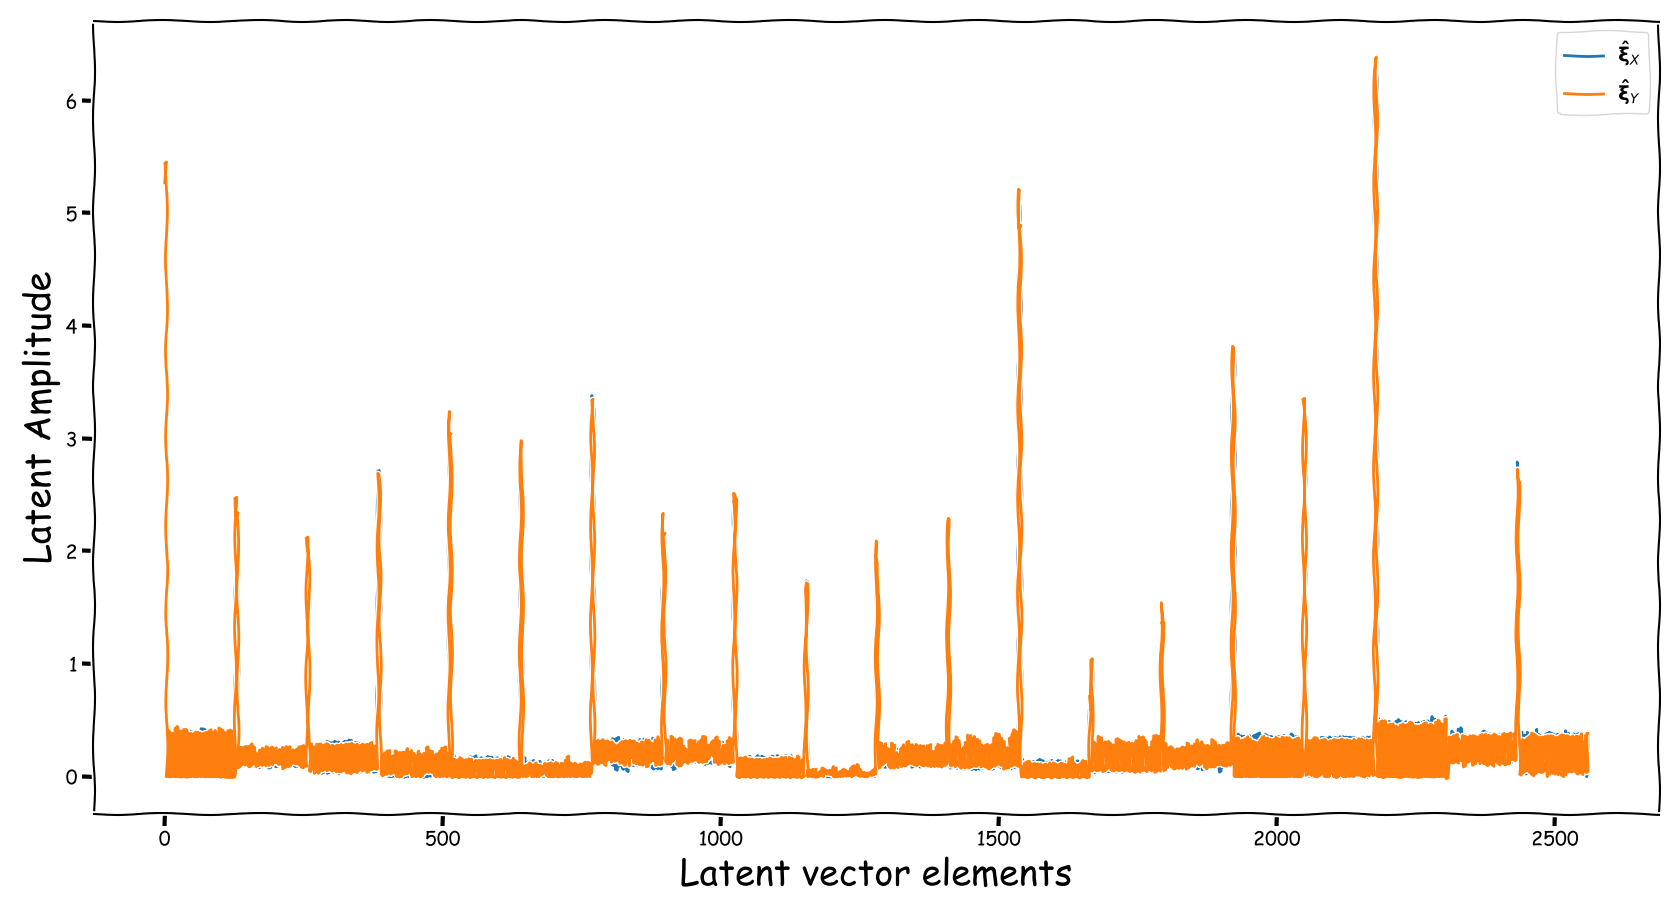
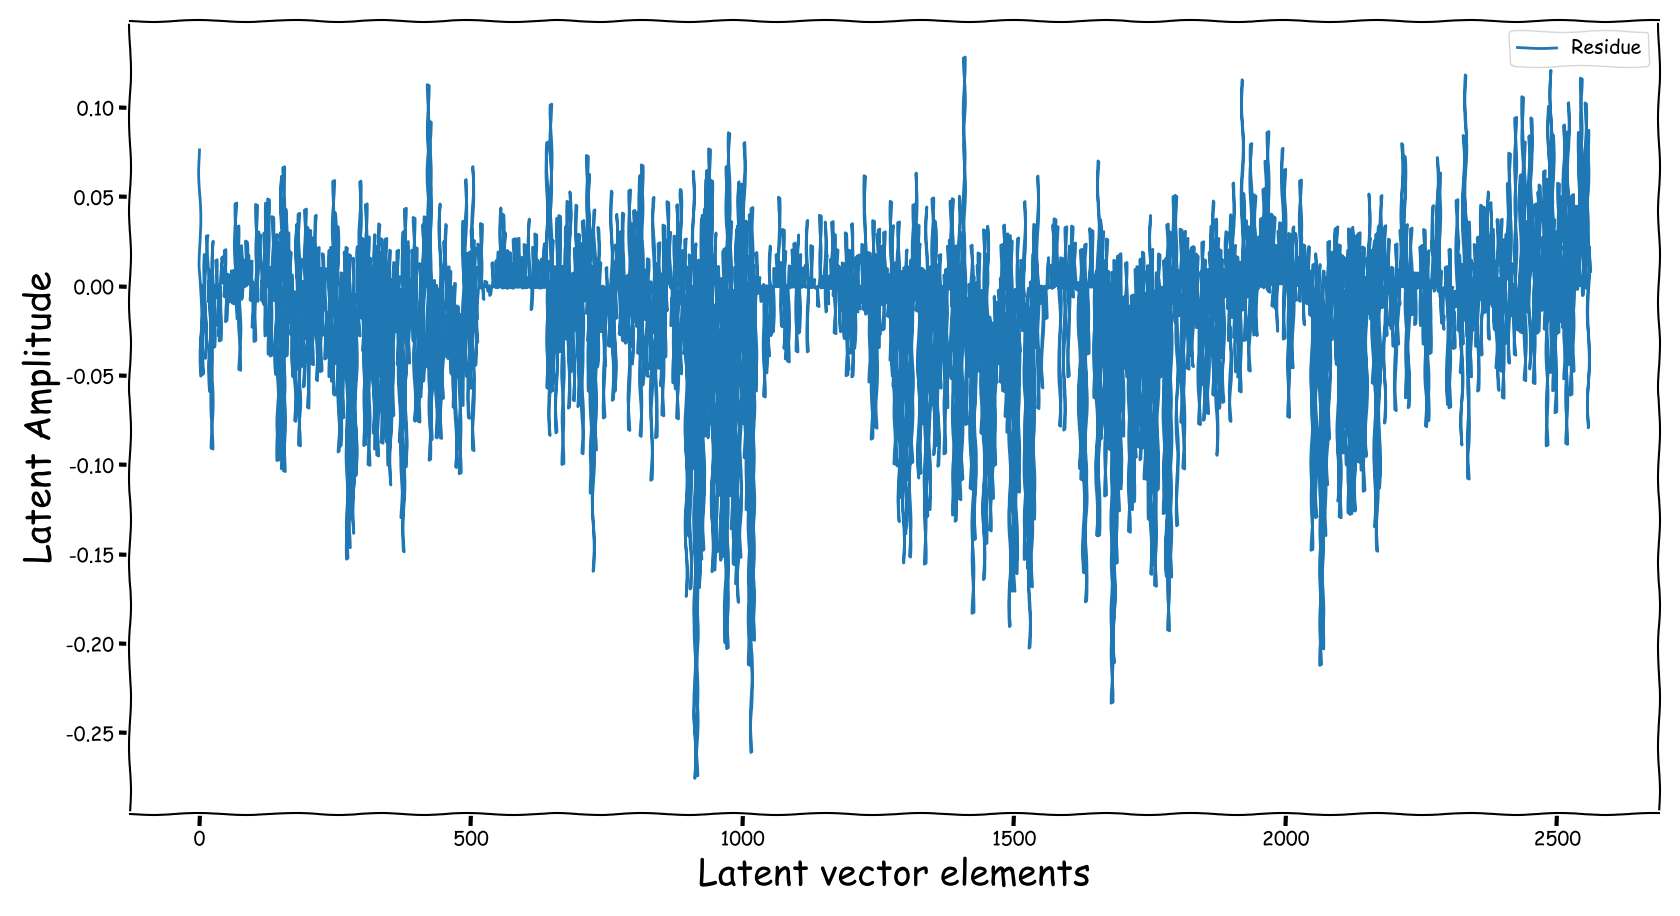
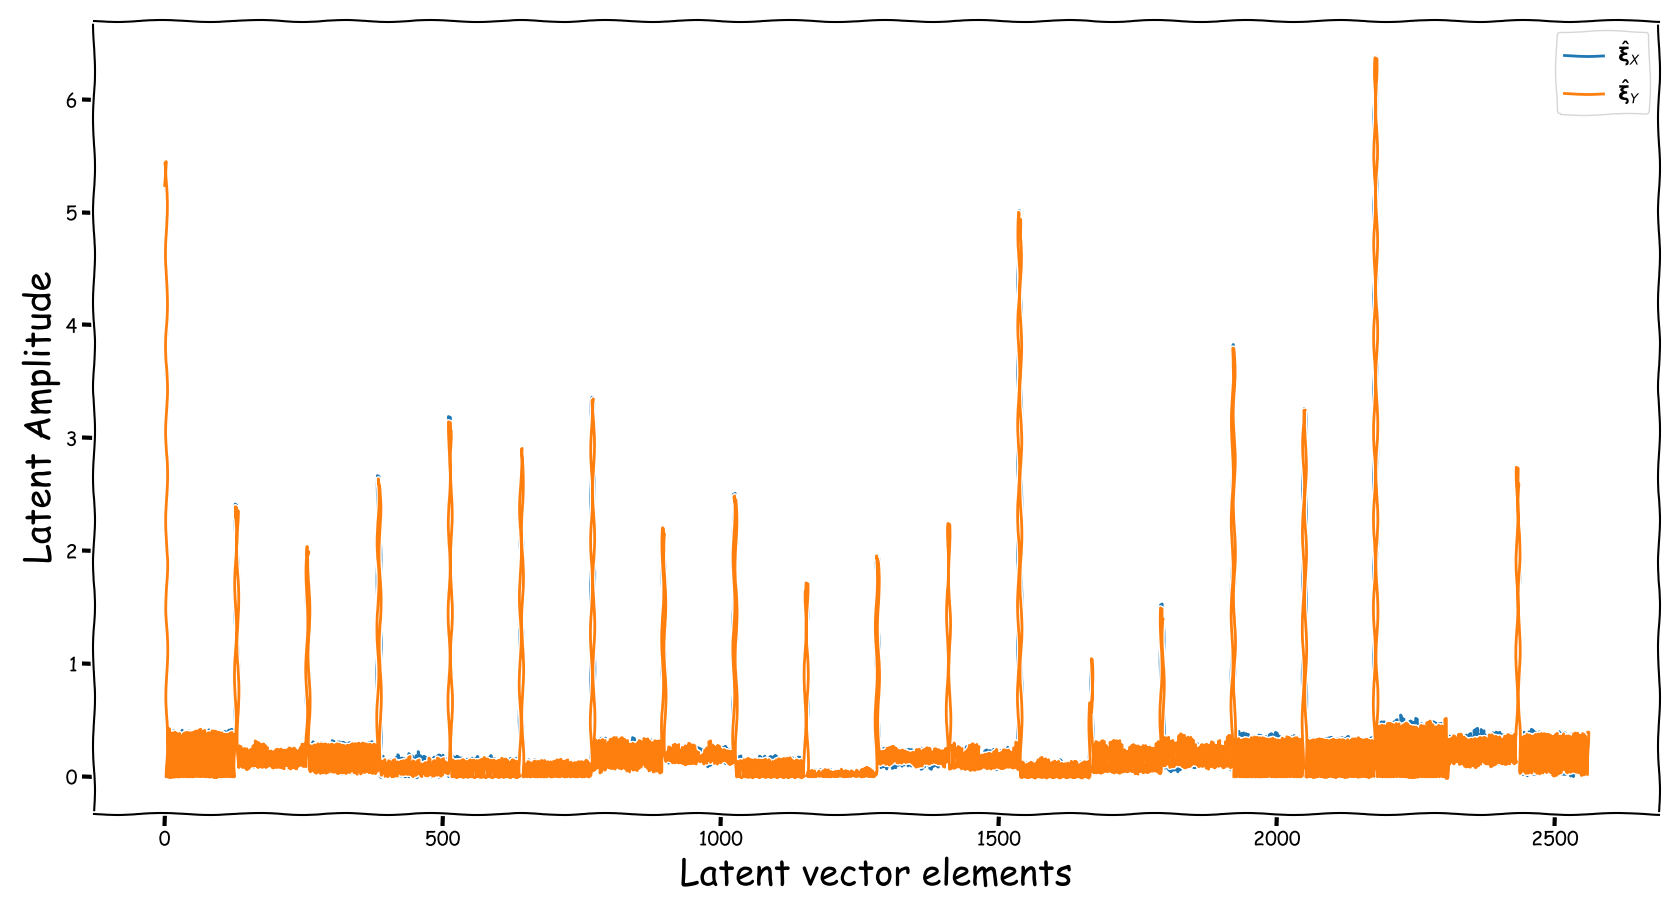
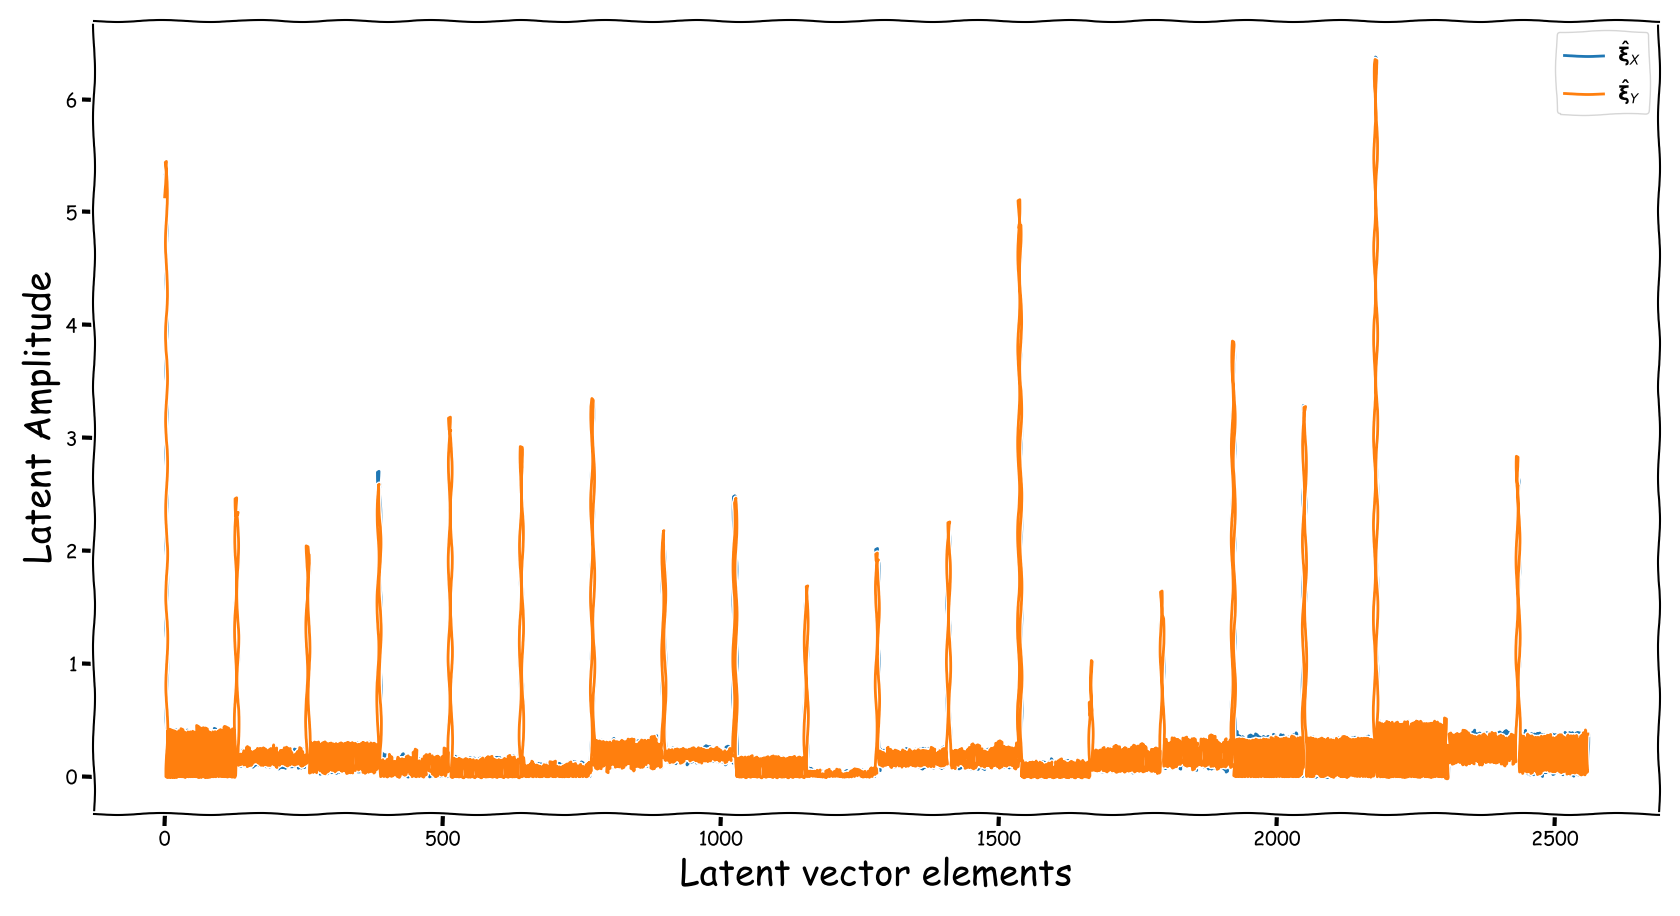
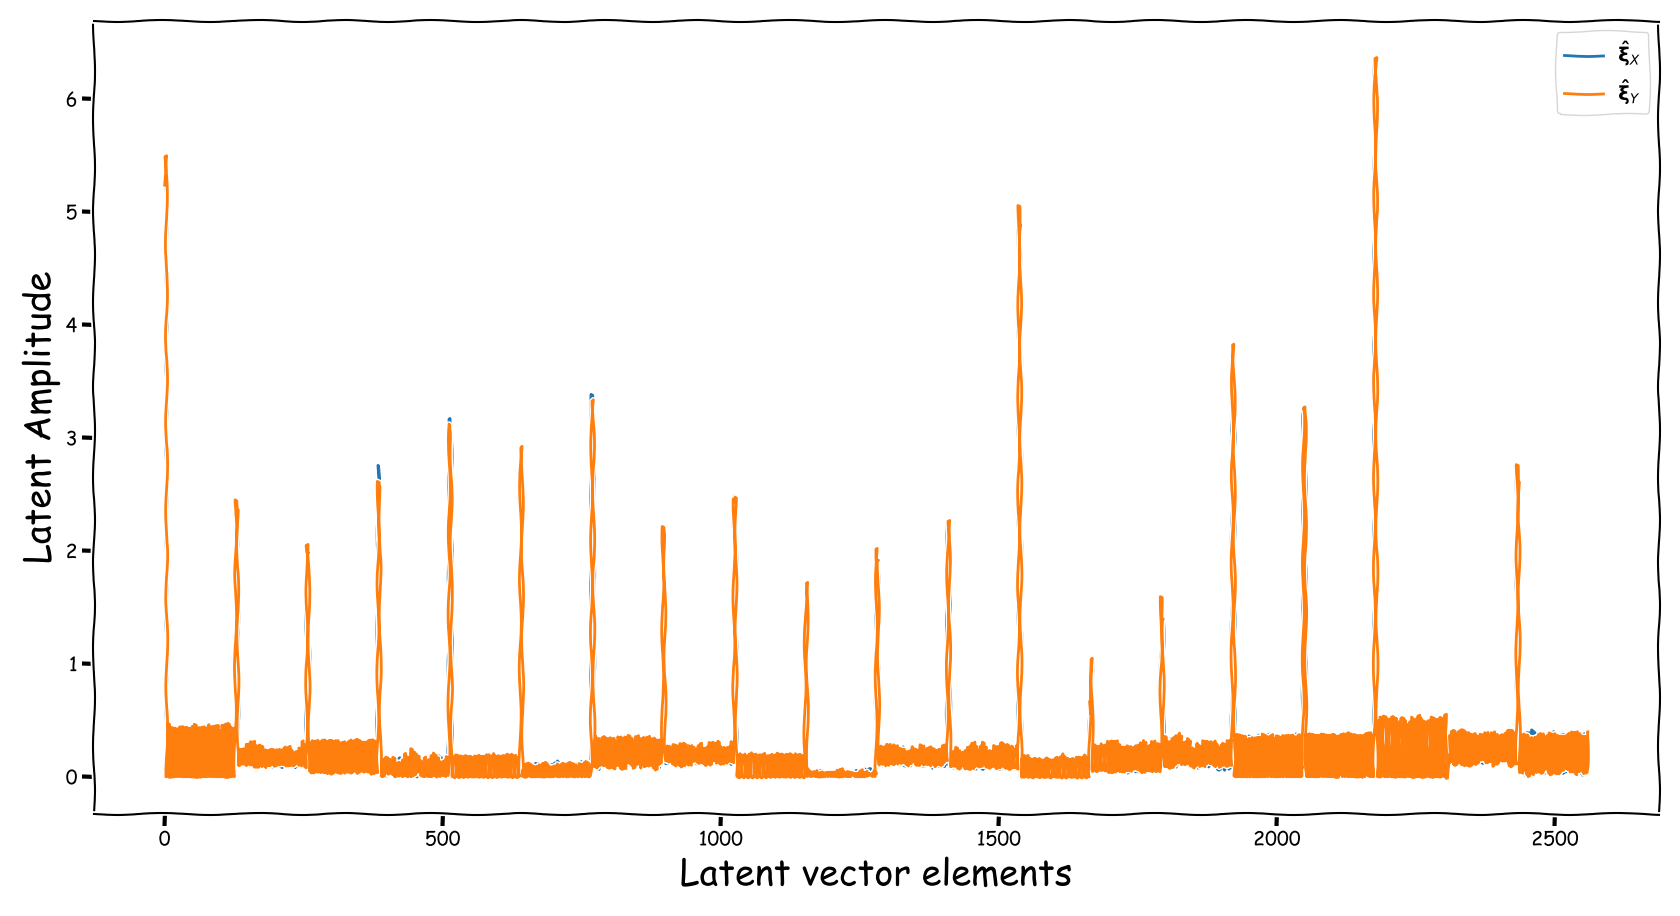
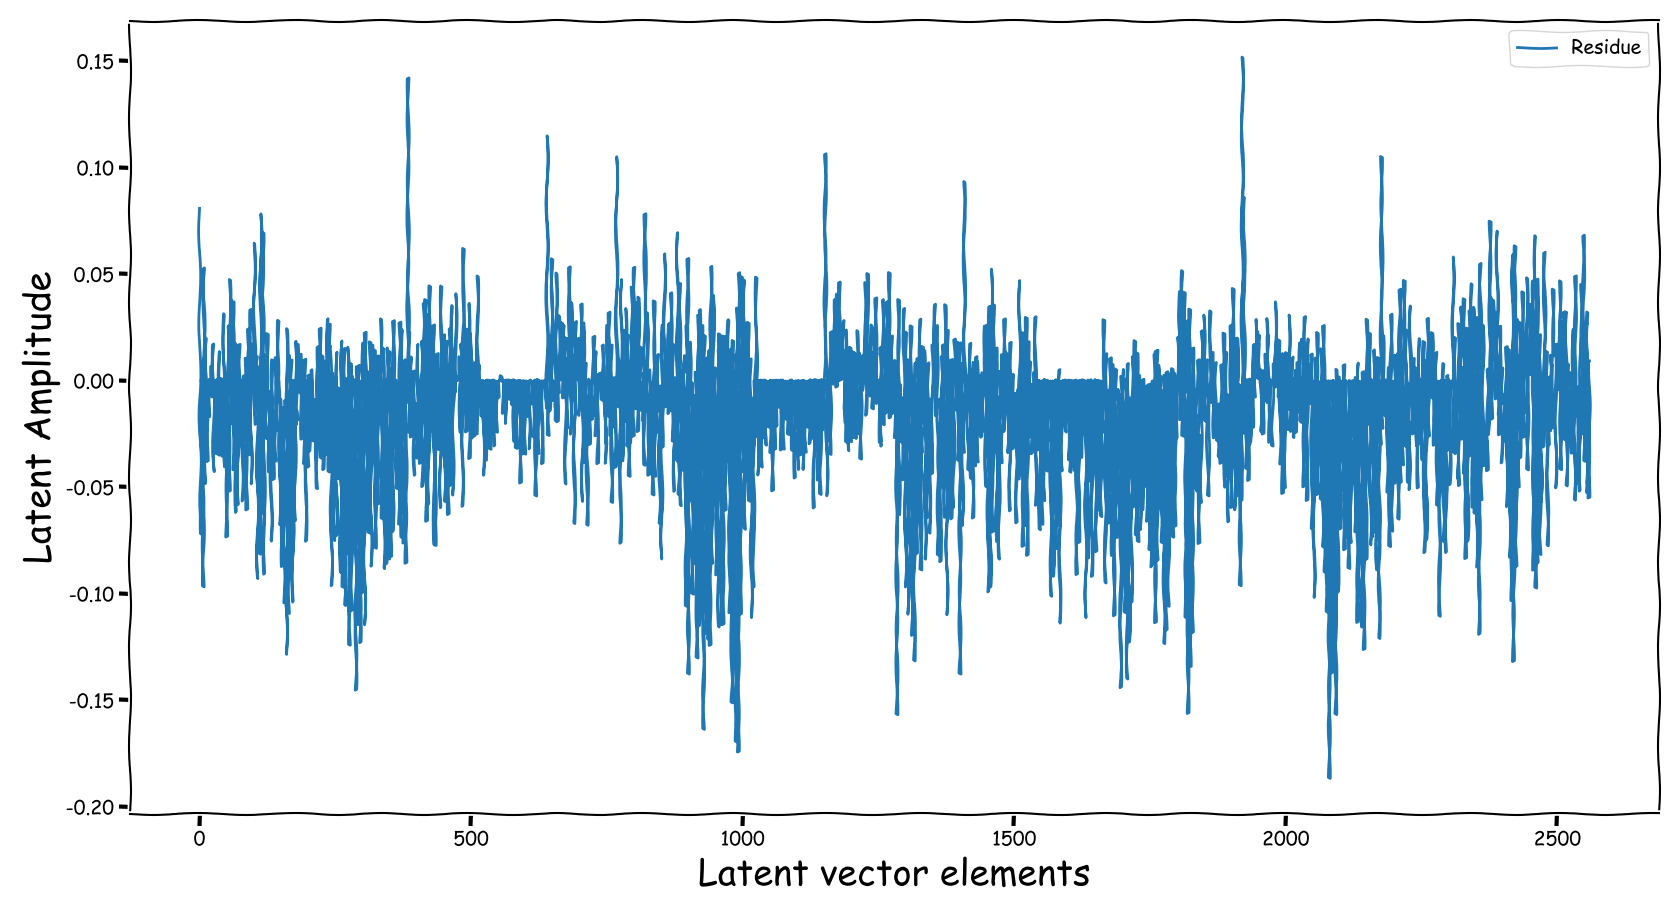
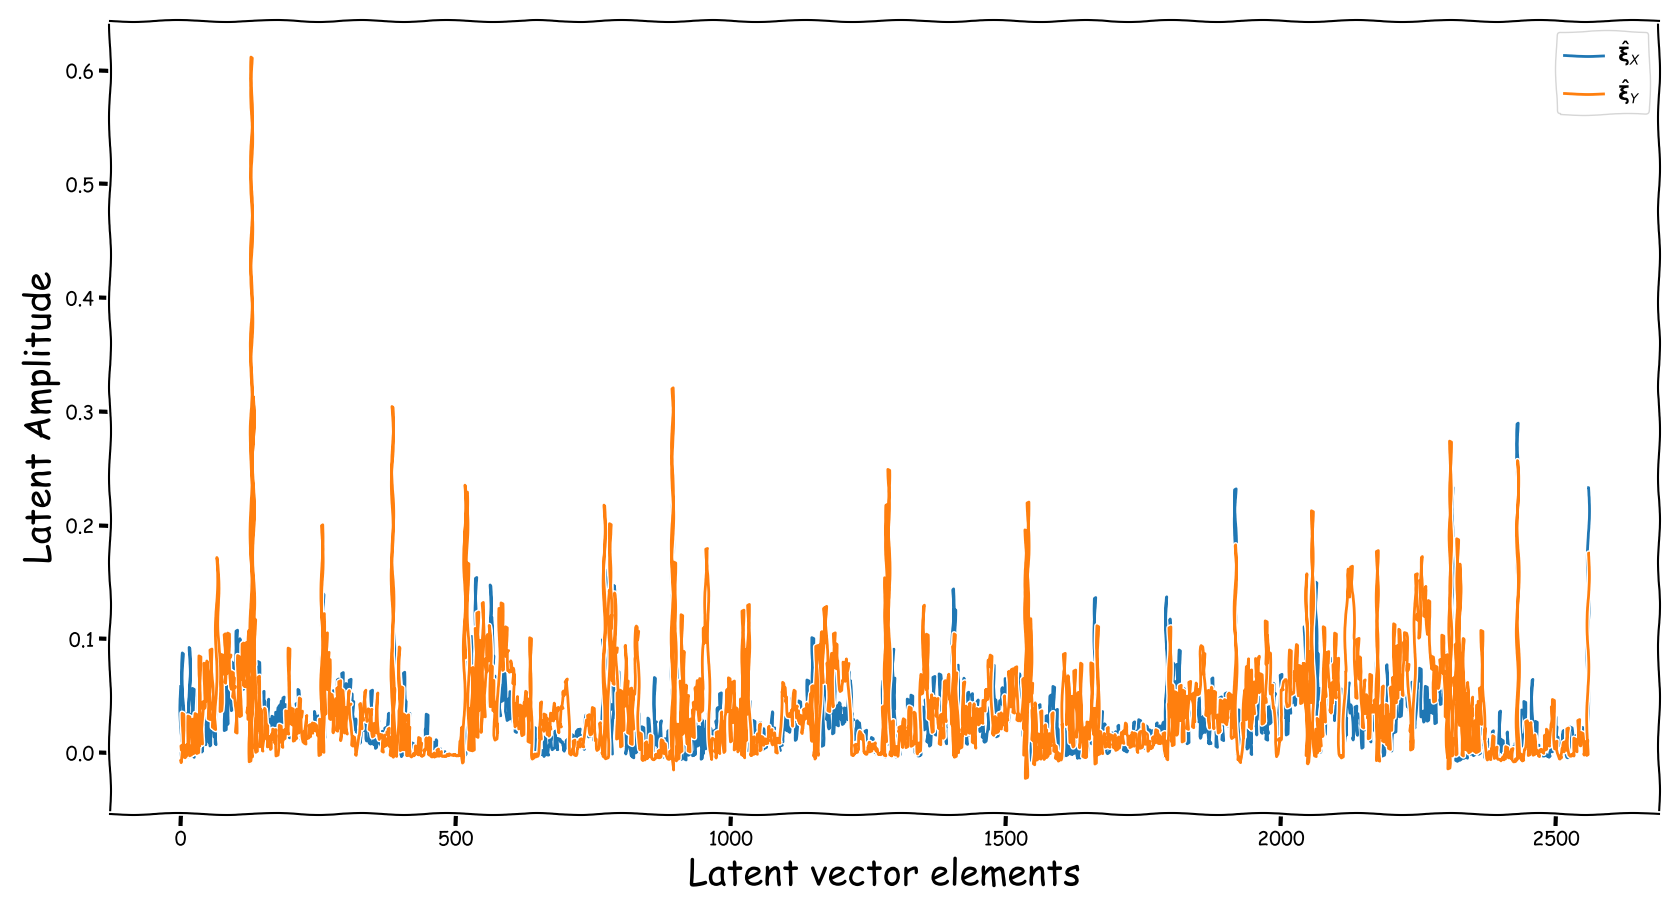
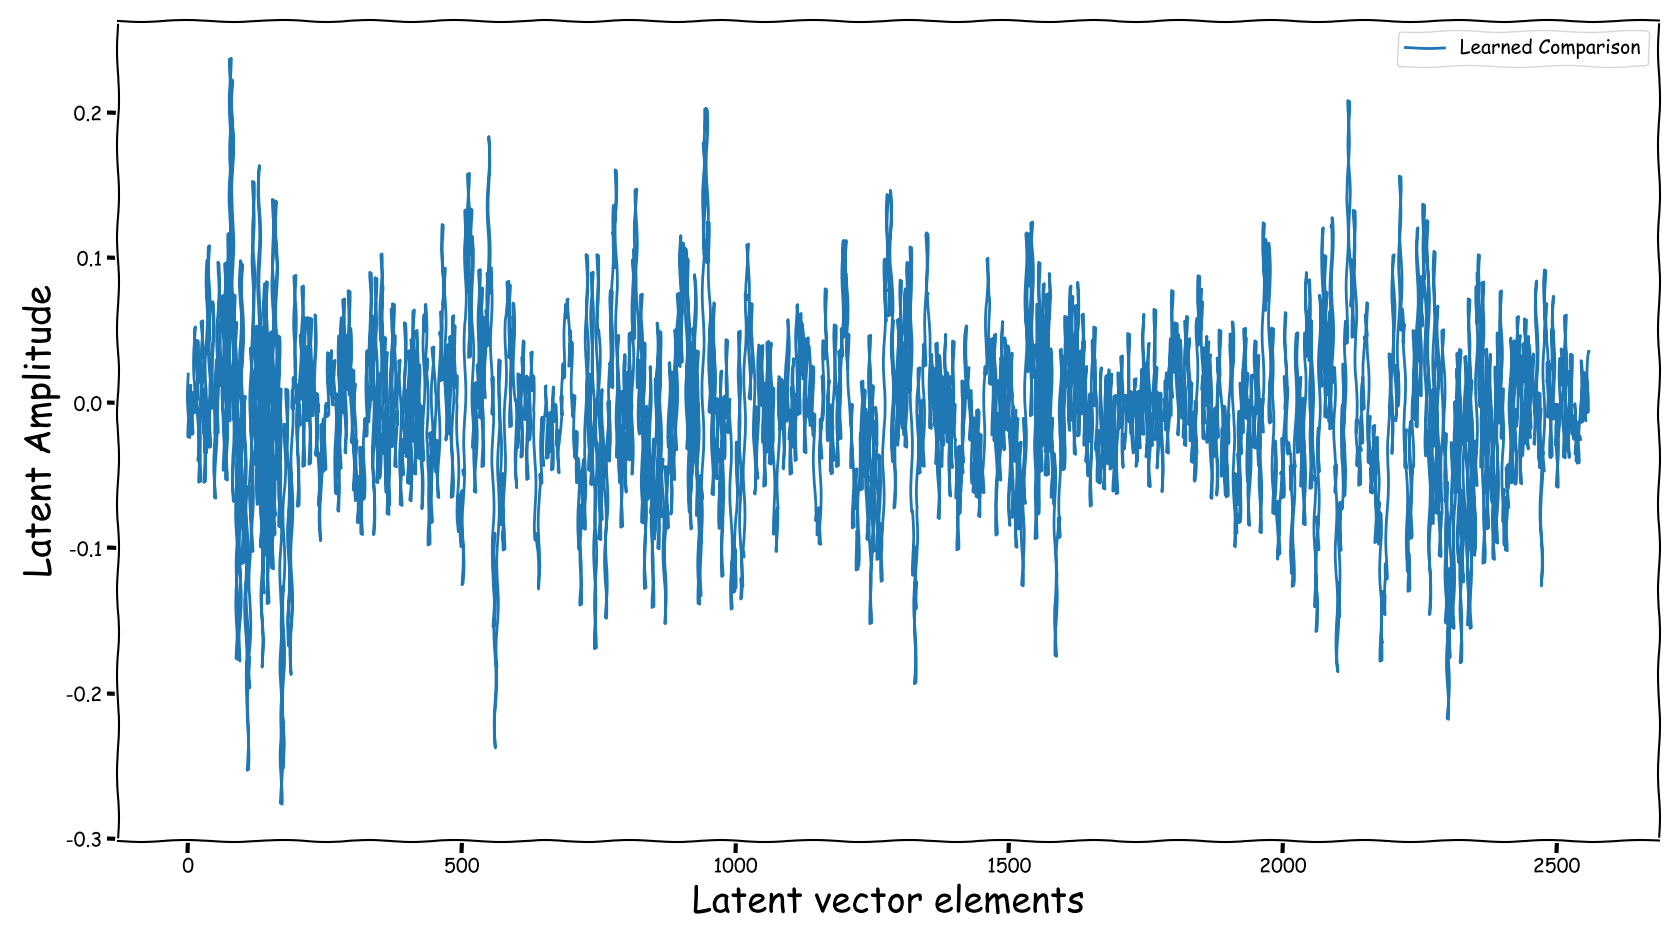
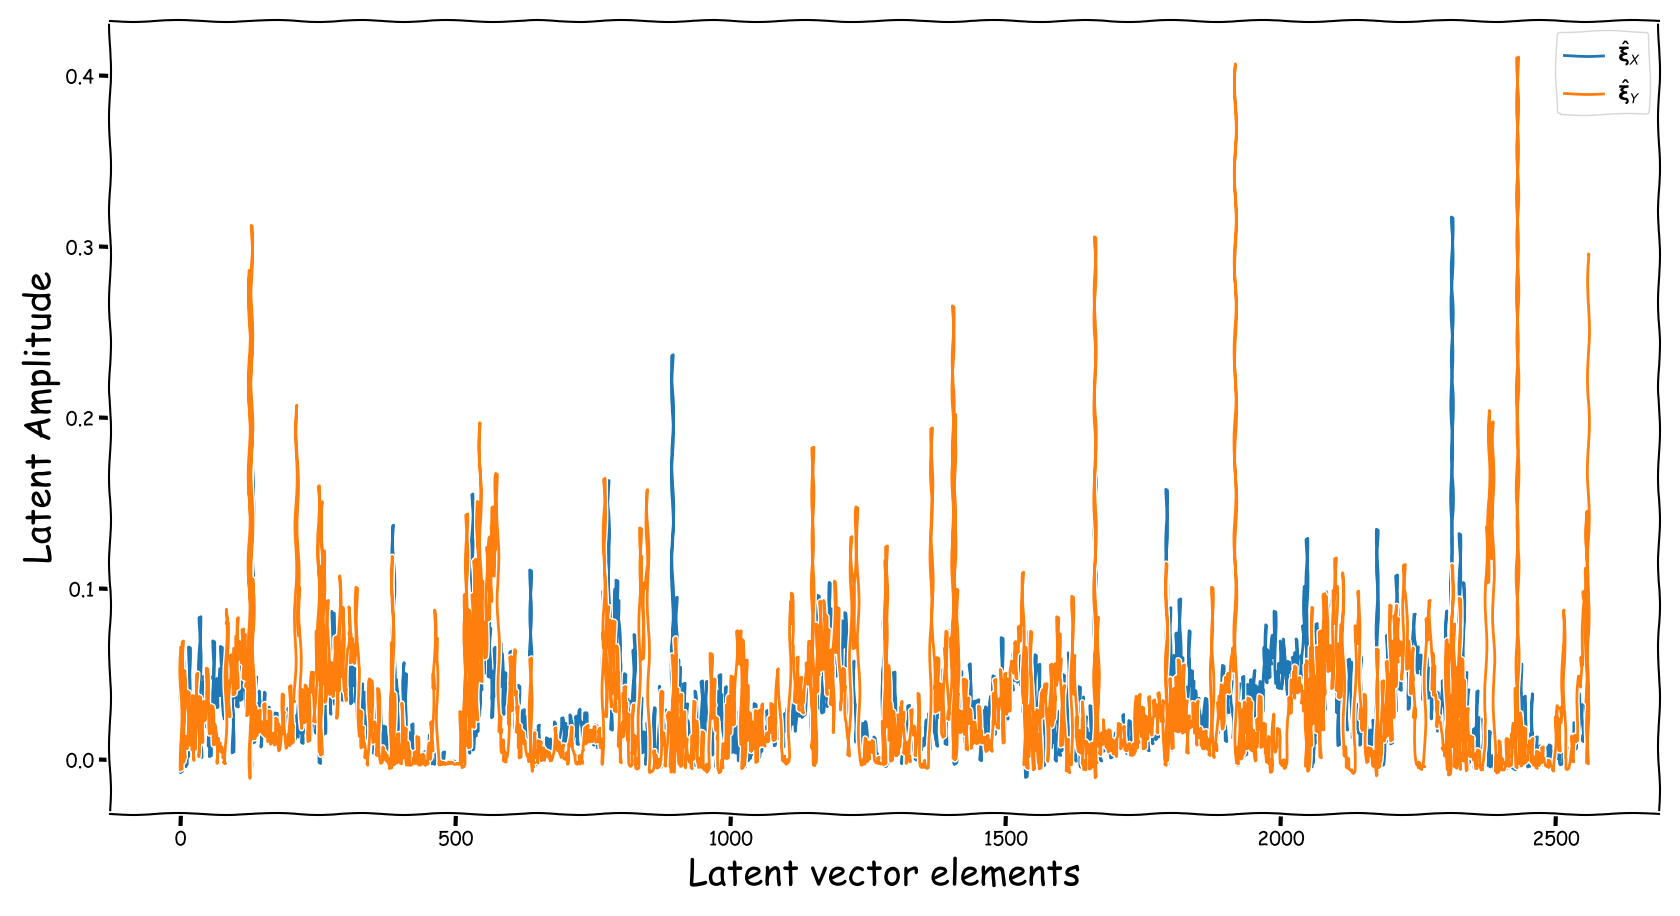
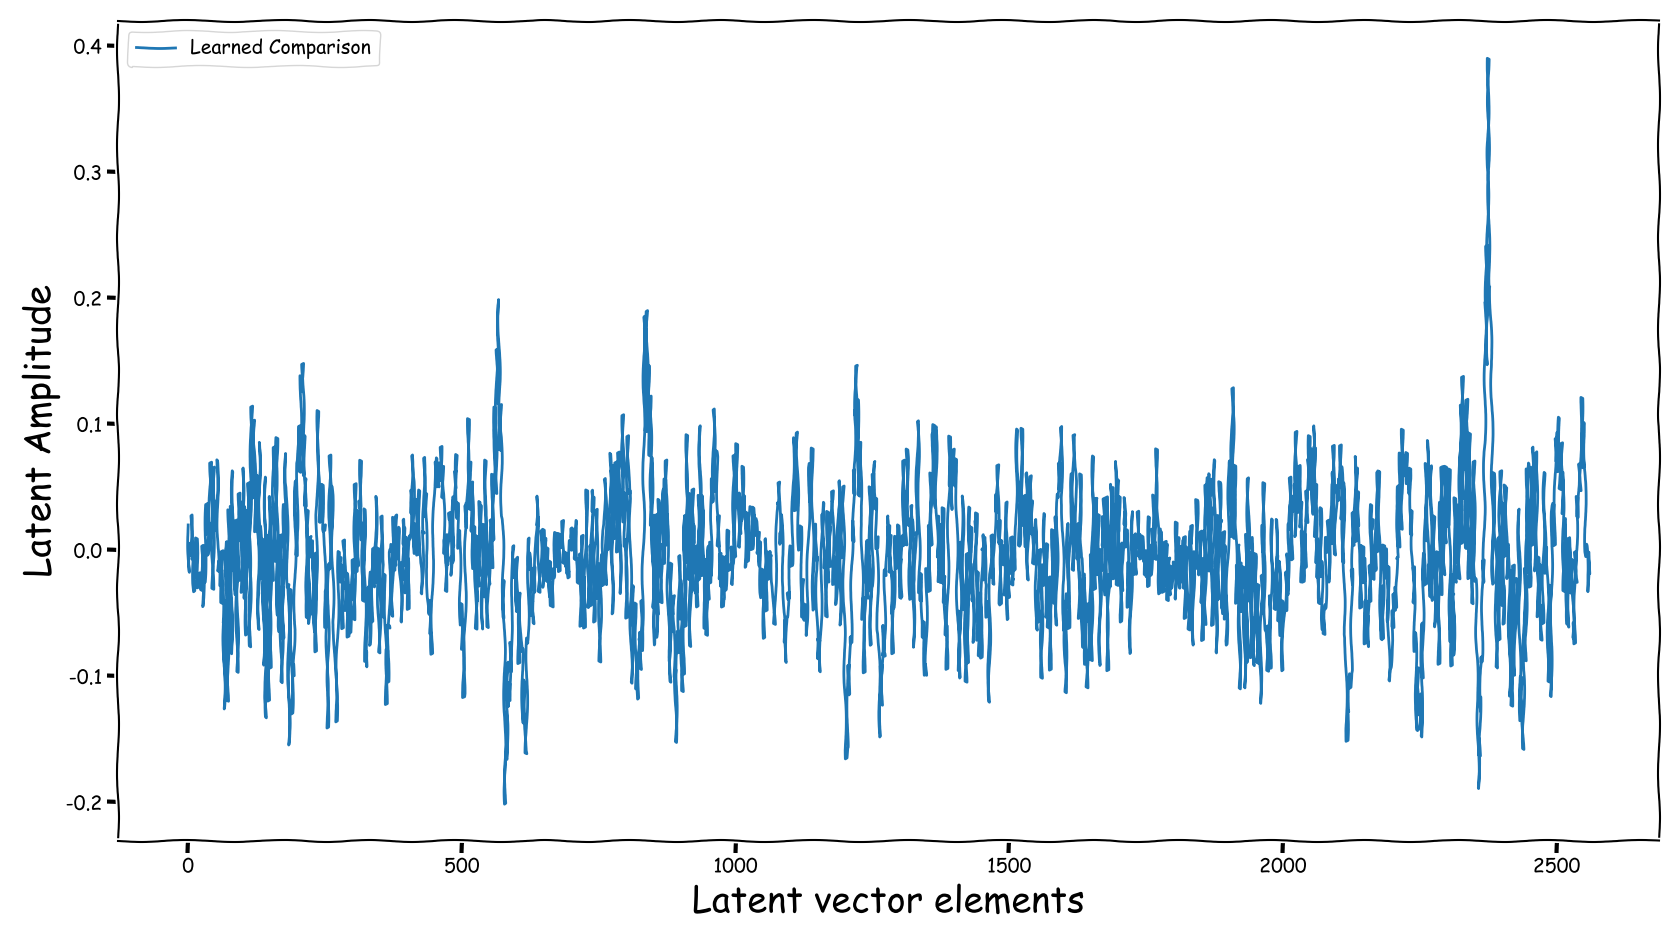
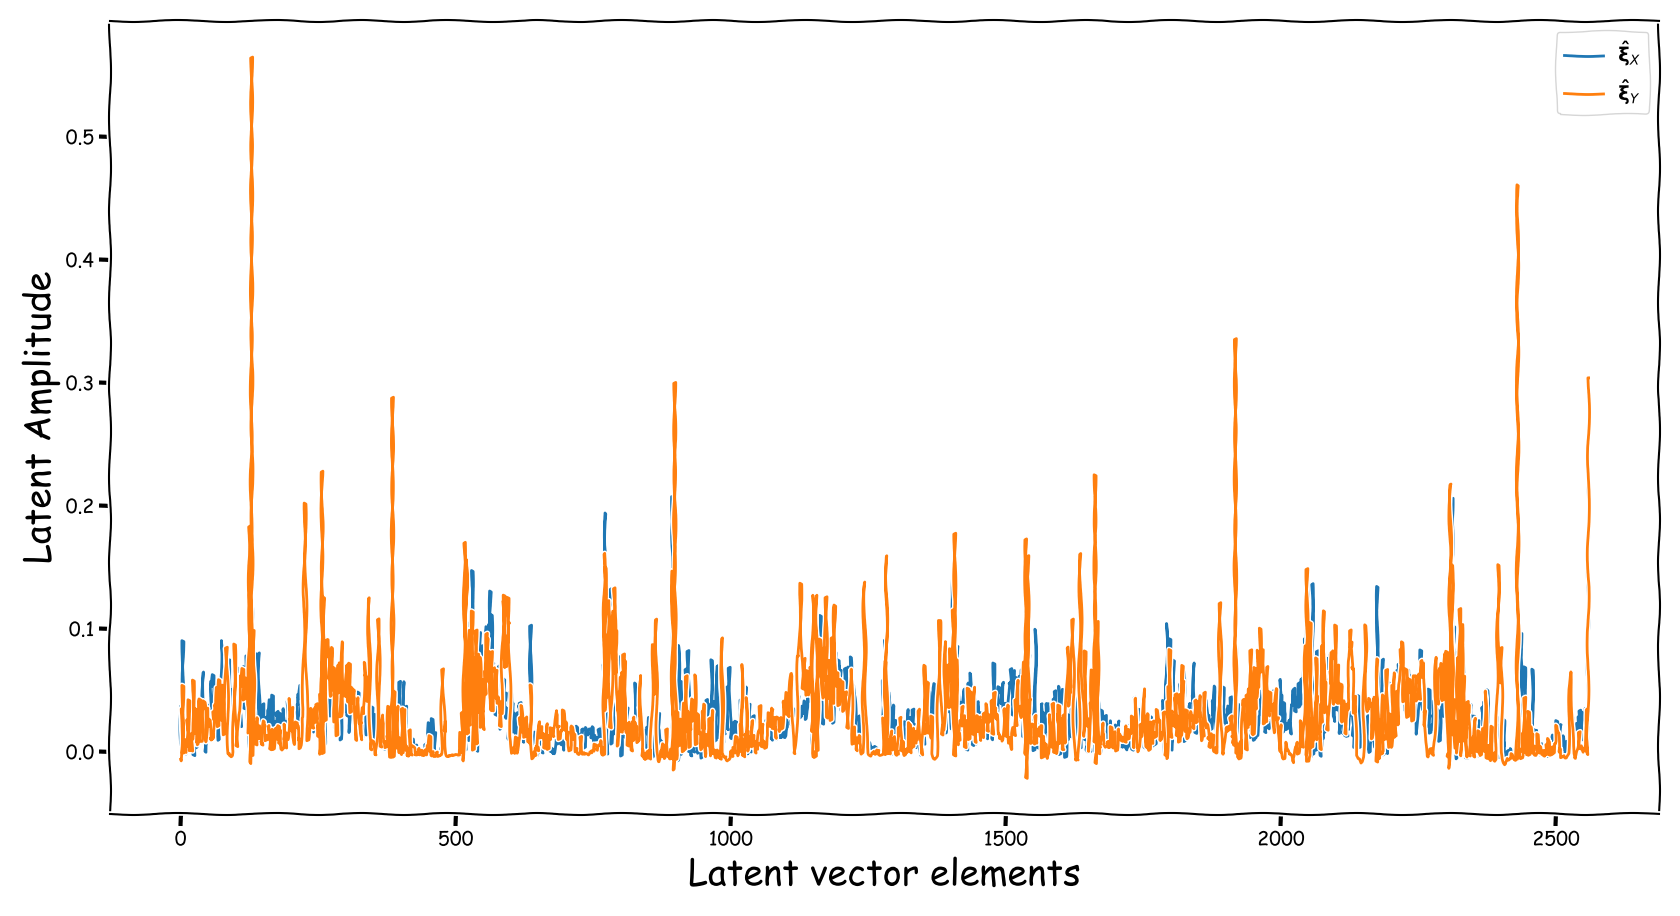
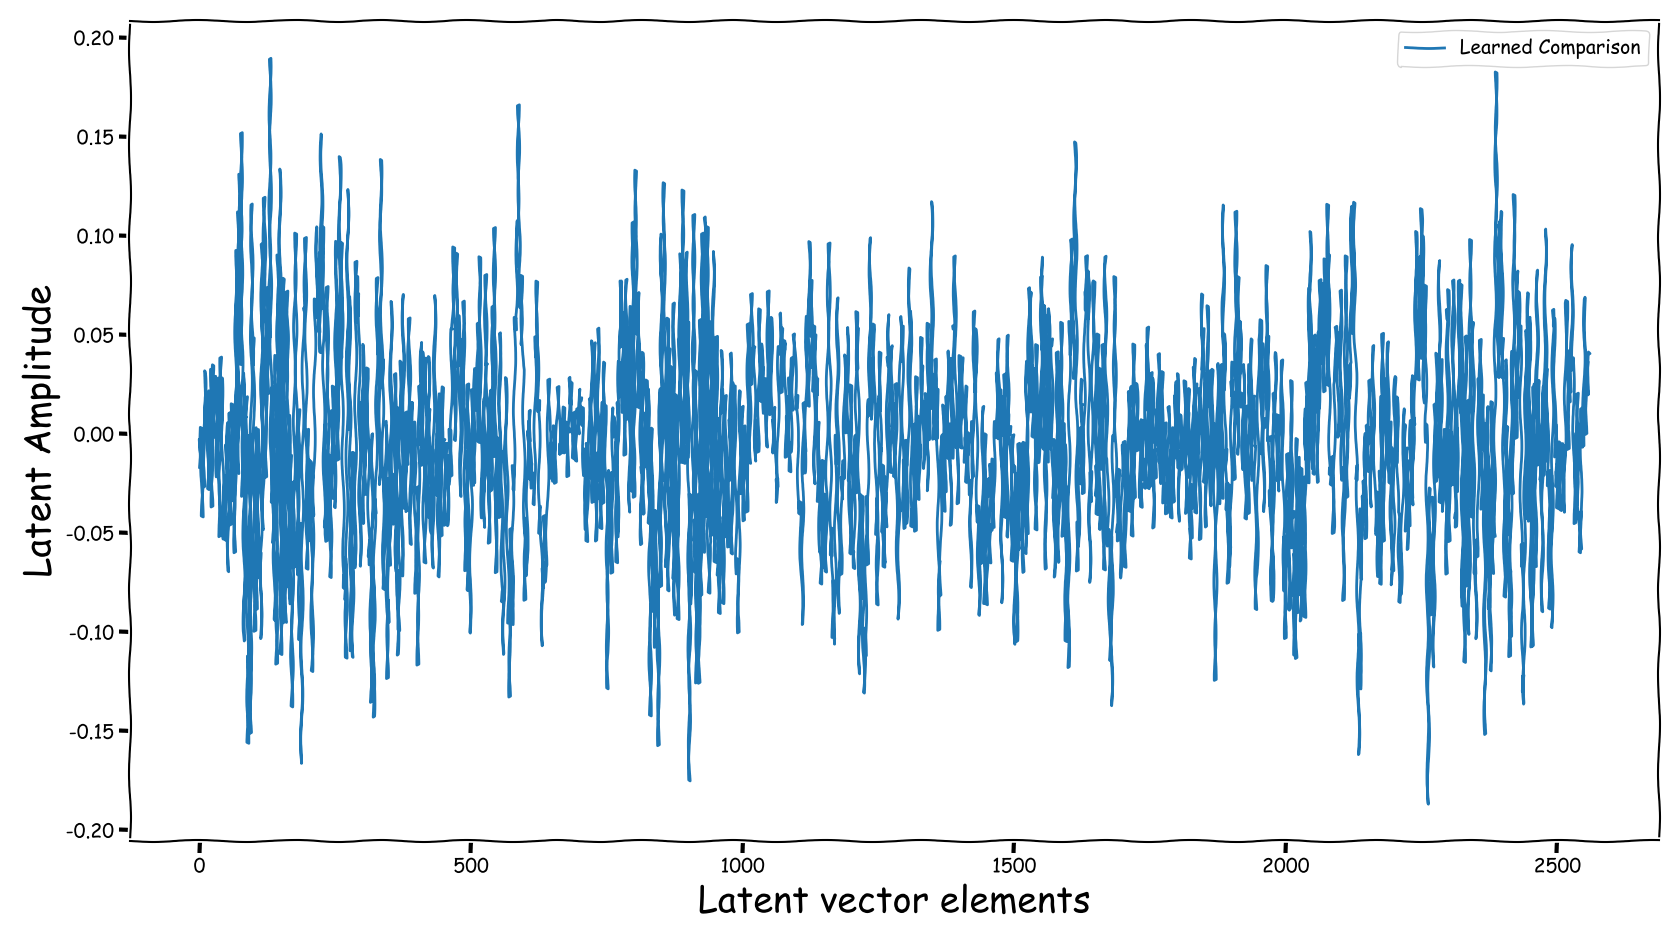
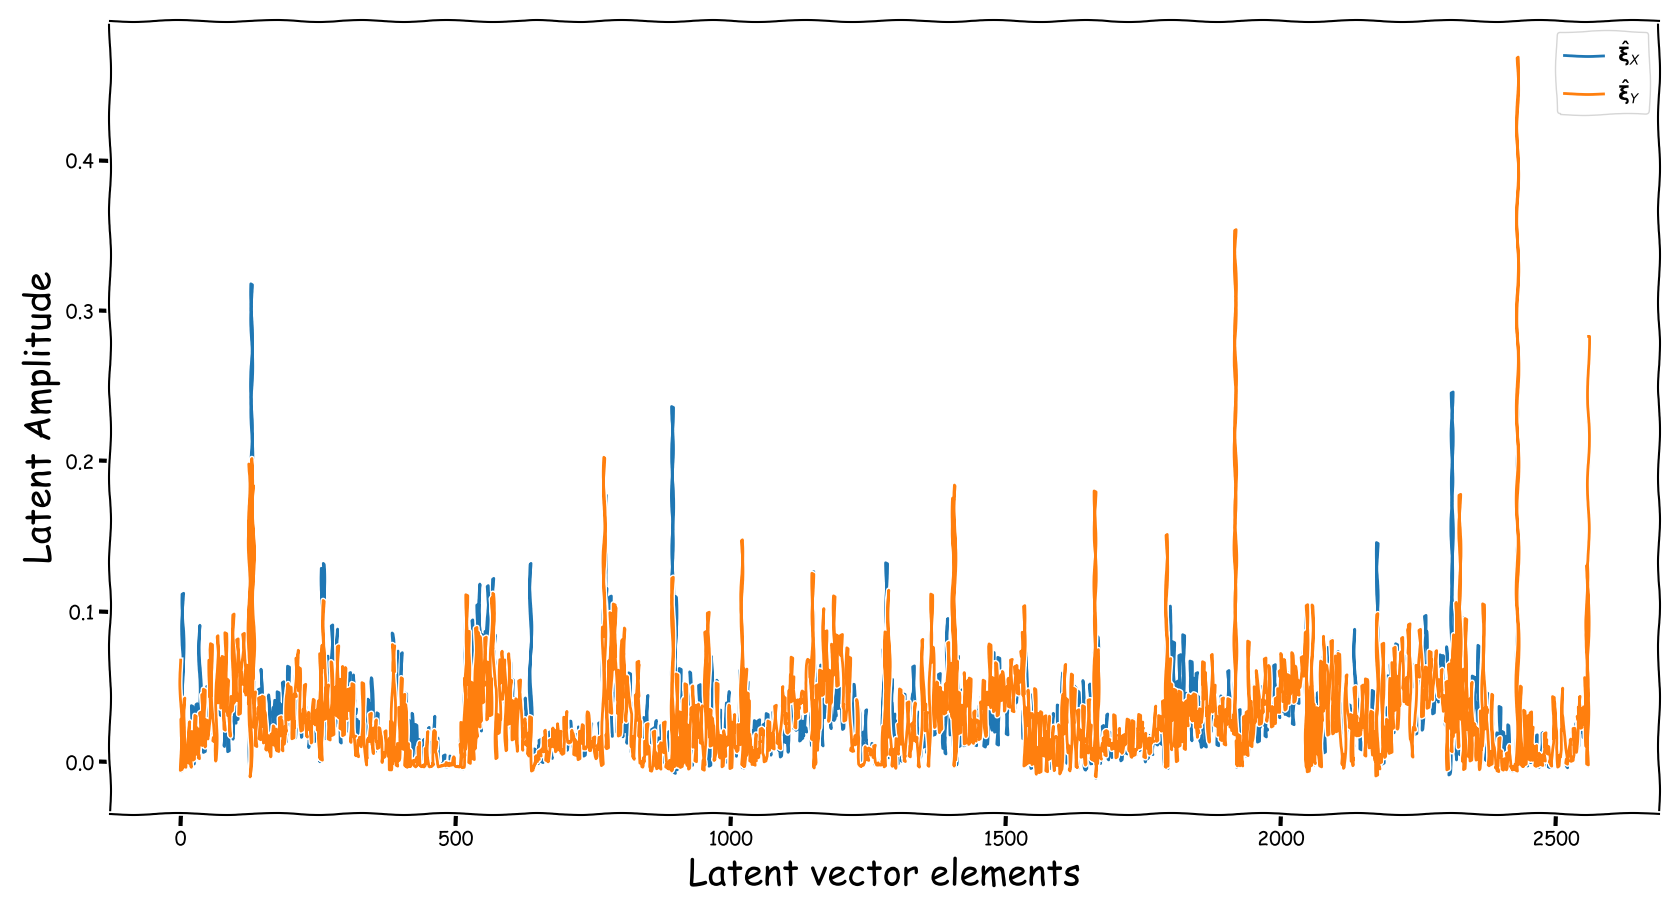
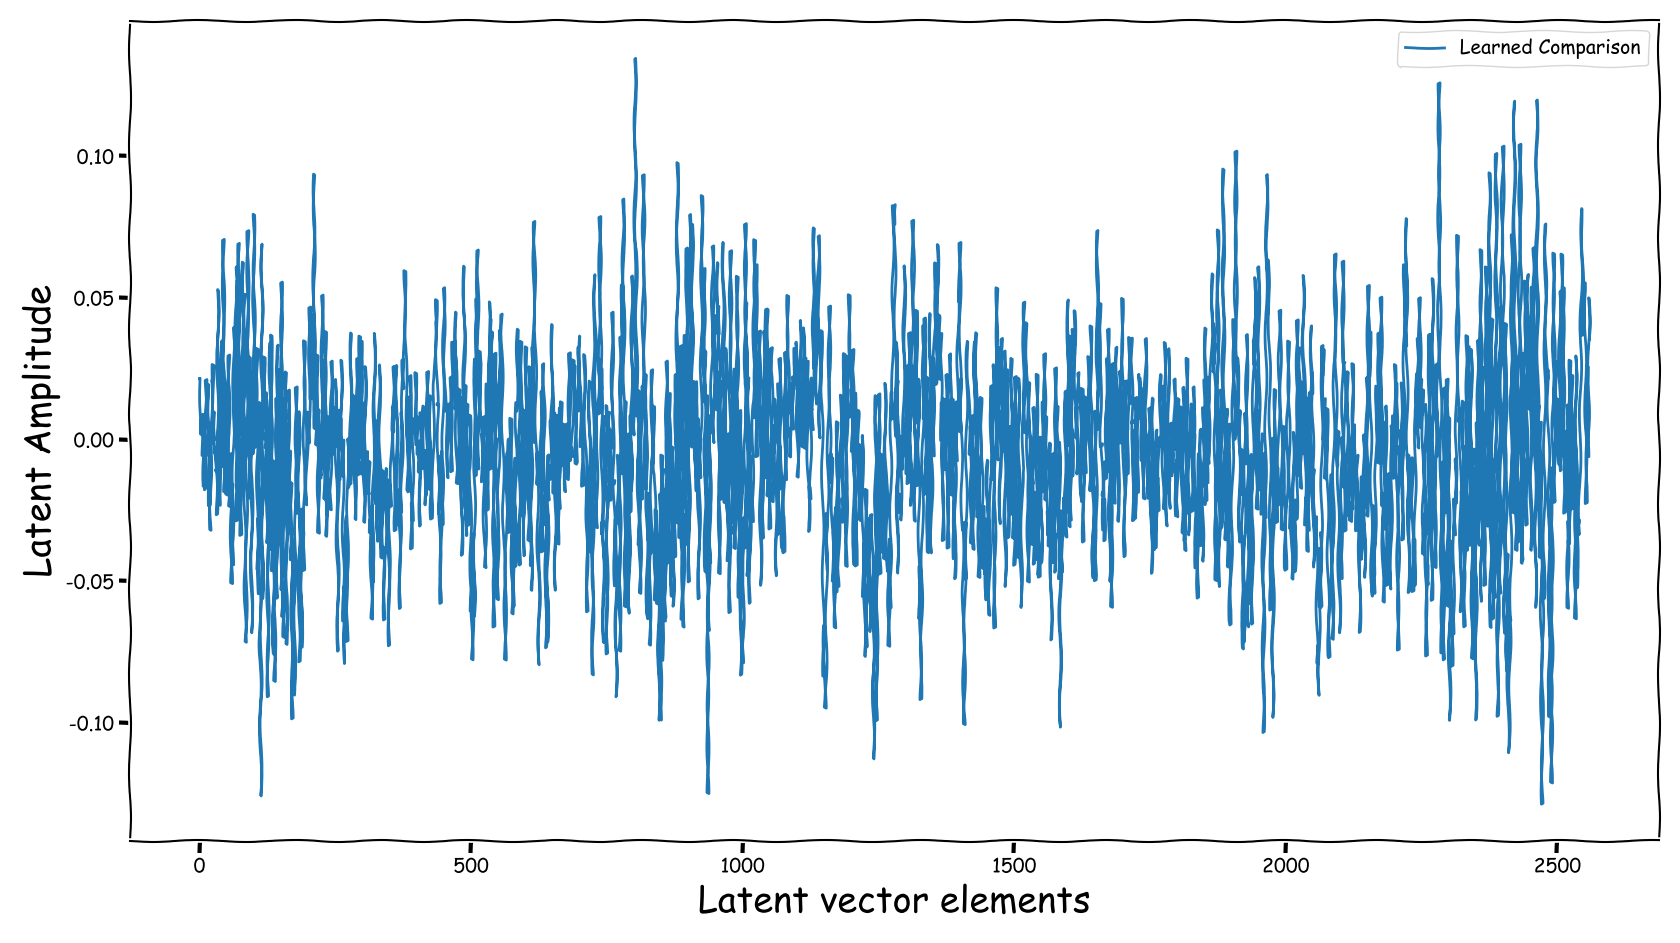
We randomly selected four data-points from the test-subset. The selection was based on the loudness of the input and reference sound files, and covering two successful and two not so successful predictions according to the computed test-error. Data-points containing less than -35 dB LUFS, were discarded. Those four data-points are served as input to the three models discussed in our paper. The following figures illustrate two signals:
- The output of the Latent Feature Extractor sub-module (extracted)
- The latent signal fed to the Predictor sub-module (fed).
Baseline model
| Extracted | Fed |
|---|---|
 |
 |
 |
 |
 |
|
 |
 |
Baseline model with dB valued representation
| Extracted | Fed |
|---|---|
 |
 |
 |
 |
 |
|
 |
 |
Proposed model with dB valued representation
| Extracted | Fed |
|---|---|
 |
 |
 |
 |
 |
 |
 |
 |
Observations & Take-home Messages
From the above collection of figures we could potentially conclude the following:
- Our theoretical expectactions, presented in the corresponding paper, are not very far away from the experimental realization (illustrated above). That is especially for the baseline models that employ a deterministic function, i.e., the element-wise subtraction, for the computation of the latent space that is fed to the predictor.
- The baseline method, that uses the element-wise subtraction, yields a degenerate (sparse and low-norm vector, wrt to our problem) latent space. This partially supports the experimental results presented in the paper.
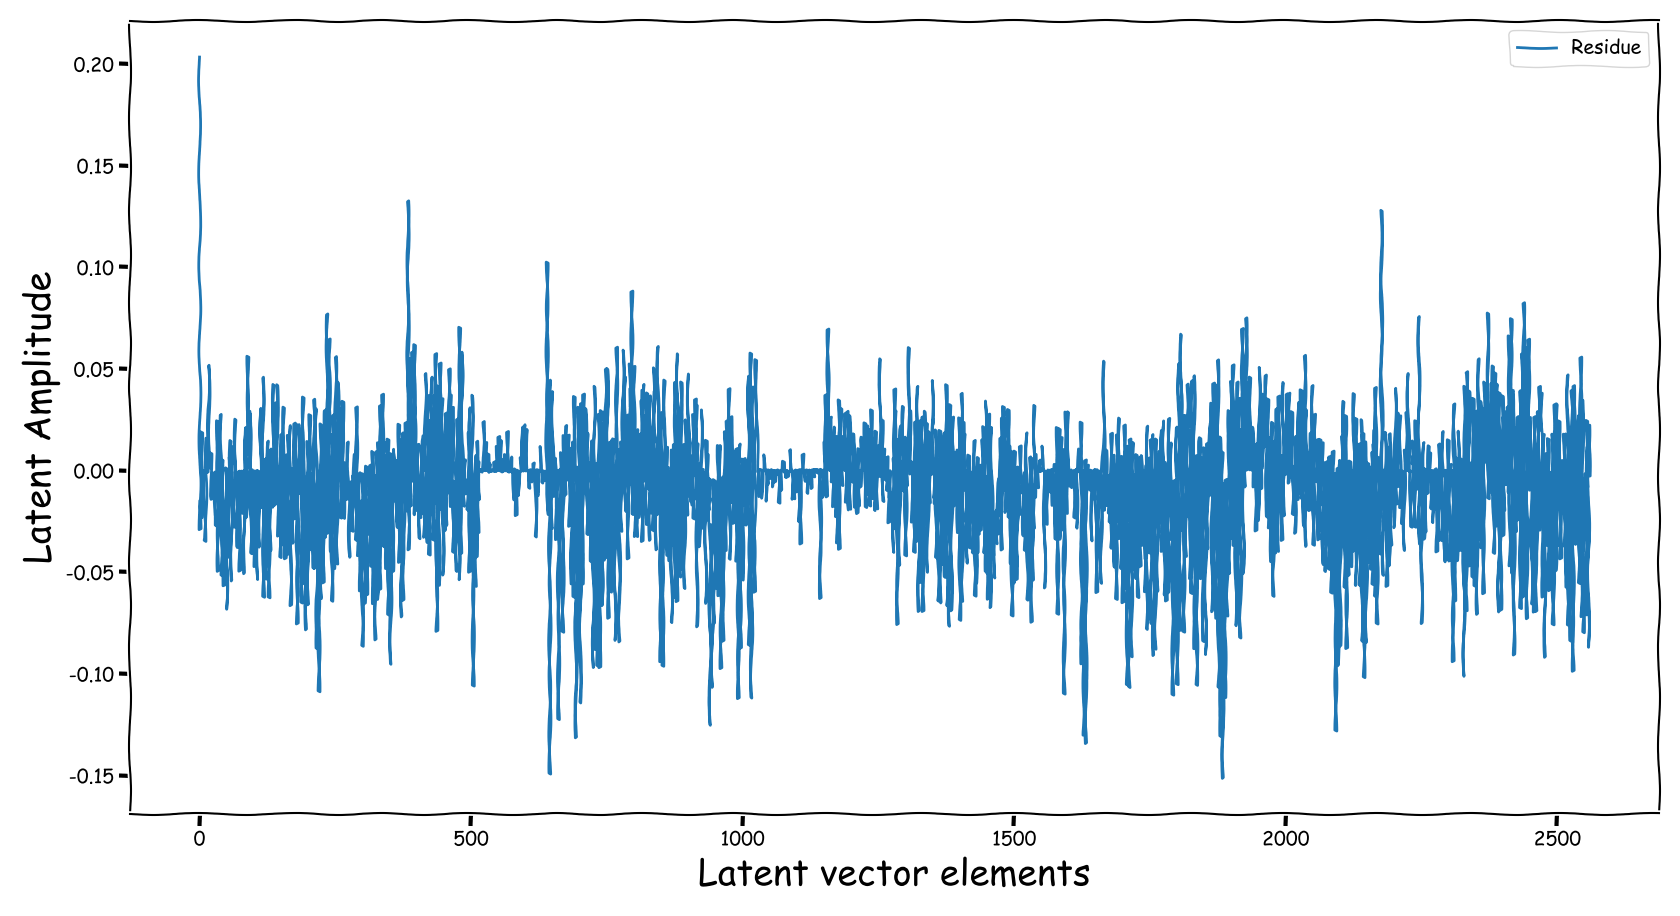
- A bartrick is to employ a dB valued representation. During training, via gradient descent, it is shown that it extends the numerical range of values in the latent space dramatically. However, this simply increases the values of the observed learned residue and the fed signal still suffers from a couple of nullified coefficients.
- Using the proposed method, the latent information fed to the predictor lies in sensible numerical ranges.
- The introduced novelties in our proposed method, not only alleviate the nullification of information relevant to the predictor, but also “bias” our expected predictor in a exploitable, for the predictor, manner.
Application Scenarios
Consider a number of speech recordings that contain a perceptually disturbing frequency content. We want to predict an EQ setting that matches the frequency of a provided produced recording. The following audio examples demonstrate the above in two scenarios:
- “Annoying high sibilance” to “produced speech content”, and vice versa
- “Muddy bass” to “produced speech content”, and vice versa
Annoying high sibilance
Example 1
| Input | Reference | Processed |
|---|---|---|
Example 2
| Input | Reference | Processed |
|---|---|---|
Example 3
| Input | Reference | Processed |
|---|---|---|
Example 4
| Input | Reference | Processed |
|---|---|---|
Example 5
| Input | Reference | Processed |
|---|---|---|
Example 6
| Input | Reference | Processed |
|---|---|---|
Example 7
| Input | Reference | Processed |
|---|---|---|
Example 8
| Input | Reference | Processed |
|---|---|---|
Muddy bass
Example 1
| Input | Reference | Processed |
|---|---|---|
Example 2
| Input | Reference | Processed |
|---|---|---|
Example 3
| Input | Reference | Processed |
|---|---|---|
Example 4
| Input | Reference | Processed |
|---|---|---|
Example 5
| Input | Reference | Processed |
|---|---|---|
Example 6
| Input | Reference | Processed |
|---|---|---|
Example 7
| Input | Reference | Processed |
|---|---|---|
Example 8
| Input | Reference | Processed |
|---|---|---|